一、Nagios監控主機配置(IP:192.168.7.249)
1、安裝nrpe服務
解壓縮
[root@nagios ~]# tar -zxvf nrpe-2.14.tar.gz
[root@nagios ~]# cd nrpe-2.14
編譯
[[root@nagios nrpe-2.14]#./configure
root@nagios nrpe-2.14]# make all
[root@nagios nrpe-2.14]# make install-plugin
只運行這一步就行了,因為只需要check_nrpe插件
2、編輯commands.cfg文件定義nrpe對的使用
[root@nagios ~]# vim /usr/local/nagios/etc/objects/commands.cfg
在最後面增加如下內容:
# 'check_nrpe ' command definition
define command{
command_name check_nrpe
command_line $USER1$/check_nrpe -H $HOSTADDRESS$ -c $ARG1$
}
說明:
command_name check_nrpe
定義命令名稱為check_nrpe,在services.cfg中要使用這個名稱.
command_line $USER1$/check_nrpe -H $HOSTADDRESS$ -c $ARG1$
這是定義實際運行的插件程序.這個命令行的書寫要完全按照check_nrpe這個命令的用法.不知道用法的就用check_nrpe –h查看
-c後面帶的$ARG1$參數是傳給nrpe daemon執行的檢測命令,之前說過了它必須是nrpe.cfg中所定義的那5條命令中的其中一條.在services.cfg中使用check_nrpe的時候要用!帶上這個參數
3、配置監控對象(工作站及其服務等)
[root@nagios ~]# vim /usr/local/nagios/etc/nagios.cfg
在cfg_file=/usr/local/nagios/etc/objects/localhost.cfg下添加:
cfg_file=/usr/local/nagios/etc/objects/services.cfg
4、新建linux.cfg設置要監控的內容(address表示被監控的客戶端IP)
[root@nagios ~]# vim /usr/local/nagios/etc/object/services.cfg
#定義被監控端名稱和地址
define host{
use linux-server
host_name server1
alias server1
address 192.168.7.93
}
#定義被監控端服務
define service{
host_name server1
service_description check_ping
check_command check_nrpe!check_ping
max_check_attempts 5
normal_check_interval 3
retry_check_interval 2
check_period 24x7
notification_interval 10
notification_period 24x7
notification_options w,u,c,r
}
define service{
host_name server1
service_description check_users
check_command check_nrpe!check_users
max_check_attempts 5
normal_check_interval 3
retry_check_interval 2
check_period 24x7
notification_interval 10
notification_period 24x7
notification_options w,u,c,r
}
define service{
host_name server1
service_description check_load
check_command check_nrpe!check_load
max_check_attempts 5
normal_check_interval 3
retry_check_interval 2
check_period 24x7
notification_interval 10
notification_period 24x7
notification_options w,u,c,r
}
define service{
host_name server1
service_description check_disk_sda3
check_command check_nrpe!check_disk_sda3
max_check_attempts 5
normal_check_interval 3
retry_check_interval 2
check_period 24x7
notification_interval 10
notification_period 24x7
notification_options w,u,c,r
}
define service{
host_name server1
service_description check_zombie_procs
check_command check_nrpe!check_zombie_procs
max_check_attempts 5
normal_check_interval 3
retry_check_interval 2
check_period 24x7
notification_interval 10
notification_period 24x7
notification_options w,u,c,r
}
define service{
host_name server1
service_description check_total_procs
check_command check_nrpe!check_total_procs
max_check_attempts 5
normal_check_interval 3
retry_check_interval 2
check_period 24x7
notification_interval 10
notification_period 24x7
notification_options w,u,c,r
}
define service{
host_name server1
service_description check_swap
check_command check_nrpe!check_swap
max_check_attempts 5
normal_check_interval 3
retry_check_interval 2
check_period 24x7
notification_interval 10
notification_period 24x7
notification_options w,u,c,r
}
define service{
host_name server1
service_description check_http
check_command check_nrpe!check_http
max_check_attempts 5
normal_check_interval 3
retry_check_interval 2
check_period 24x7
notification_interval 10
notification_period 24x7
notification_options w,u,c,r
}
define service{
host_name server1
service_description check_ssh
check_command check_nrpe!check_ssh
max_check_attempts 5
normal_check_interval 3
retry_check_interval 2
check_period 24x7
notification_interval 10
notification_period 24x7
notification_options w,u,c,r
}
define service{
host_name server1
service_description check_mysql
check_command check_nrpe!check_mysql
max_check_attempts 5
normal_check_interval 3
retry_check_interval 2
check_period 24x7
notification_interval 10
notification_period 24x7
notification_options w,u,c,r
}
//對以上的linux.cfg文件編輯如果有錯,將會導致nagios無法啟動;
驗證Nagios 配置文件
[root@nagios ~]# /usr/local/nagios/bin/nagios -v /usr/local/nagios/etc/nagios.cfg
5、重啟
[root@nagios ~]#service nagios restart
[root@nagios ~]#service httpd restart
6、測試無法訪問,檢查一下IPtables是否關閉。
[root@nagios ~]# service iptables status
添加nrpe 5666端口:
[root@nagios ~]# vim /etc/sysconfig/iptables
-A INPUT -m state --state NEW -m tcp -p tcp --dport 5666 -j ACCEPT
[root@nagios ~]# service iptables restart
測試一下監控機使用check_nrpe與被監控機運行的nrpedaemon之間的通信.
[root@nagios ~]# /usr/local/nagios/libexec/check_nrpe -H 192.168.7.93 //被監控制端IP地址
NRPE v2.14
二、Linux被監控主機配置(IP:192.168.7.93)
1、增加用戶
[root@web ~]# useradd nagios
[root@web ~]# passwd nagios
2、安裝nagios插件
解壓縮
[root@web ~]# tar -zxvf nagios-plugins-1.4.16.tar.gz
[root@web ~]# cd nagios-plugins-1.4.16
編譯安裝
[root@web nagios-plugins-1.4.16]# ./configure --with-nagios-user=nagios --with-nagios-group=nagios
[root@web nagios-plugins-1.4.16]# make;make install
這一步完成後會在/usr/local/nagios/下生成兩個目錄libexec和share
[root@web ~]# ls /usr/local/nagios/
include libexec share
改變目錄權限使nagios用戶能夠訪問
[root@web ~]# chown -R nagios.nagios /usr/local/nagios
[root@web ~]# chown -R nagios.nagios /usr/local/nagios/libexec
3、安裝nrpe服務
解壓縮
[root@web ~]# tar -zxvf nrpe-2.14.tar.gz
[root@web ~]# cd nrpe-2.14
編譯
[root@web nrpe-2.14]#./configure
輸出如下
*** Configuration summary for nrpe 2.8.1 05-10-2007 ***:
General Options:
-------------------------
NRPE port: 5666
NRPE user: nagios
NRPE group: nagios
Nagios user: nagios
Nagios group: nagios
Review the options above for accuracy. If they look okay,
type 'make all' to compile the NRPE daemon and client.
可以看到NRPE的端口是5666,下一步是make all
[root@web nrpe-2.14]# make all
輸出如下
*** Compile finished ***
If the NRPE daemon and client compiled without any errors, you
can continue with the installation or upgrade process.
Read the PDF documentation (NRPE.pdf) for information on the next
steps you should take to complete the installation or upgrade.
接下來安裝NPRE插件,daemon和示例配置文件
安裝check_nrpe這個插件
[root@web nrpe-2.14]# make install-plugin
之前說過監控機需要安裝check_nrpe這個插件,被監控機並不需要,我們在這裡安裝它是為了測試的目的
安裝deamon
[root@web nrpe-2.14]# make install-daemon
安裝配置文件
[root@web nrpe-2.14]# make install-daemon-config
現在再查看nagios目錄就會發現有5個目錄
[root@web nrpe-2.14]# ls /usr/local/nagios/
bin etc include libexec share
按照安裝文檔的說明,是將NRPE deamon作為xinetd下的一個服務運行的.在這樣的情況下xinetd就必須要先安裝好,不過一般系統已經默認裝了
4、安裝xinetd腳本
[root@web nrpe-2.14]# make install-xinetd
輸出如下
/usr/bin/install -c -m 644 sample-config/nrpe.xinetd /etc/xinetd.d/nrpe
可以看到創建了這個文件/etc/xinetd.d/nrpe
編輯這個腳本
[root@web ~]# vim /etc/xinetd.d/nrpe
# default: on
# description: NRPE (Nagios Remote Plugin Executor)
service nrpe
{
flags = REUSE
socket_type = stream
port = 5666
wait = no
user = nagios
group = nagios
server = /usr/local/nagios/bin/nrpe
server_args = -c /usr/local/nagios/etc/nrpe.cfg --inetd
log_on_failure += USERID
disable = no
only_from = 127.0.0.1 //在後面增加監控主機的地址,例如:192.168.7.249
}
改後
only_from = 127.0.0.1,192.168.7.249
配置nrpe信息
[root@web ~]# vi /usr/local/nagios/etc/nrpe.cfg
81 allowed_hosts=127.0.0.1,192.168.7.249 //允許192.168.7.249服務器端對其監控
將219-223這5行注釋掉,並在末尾添加如下命令:
command[check_ping]=/usr/local/nagios/libexec/check_ping -H 192.168.7.93 -w 3000.0,80% -c 5000.0,100% -p 5
command[check_users]=/usr/local/nagios/libexec/check_users -w 5 -c 10
command[check_load]=/usr/local/nagios/libexec/check_load -w 15,10,5 -c 30,25,20
command[check_disk_sda3]=/usr/local/nagios/libexec/check_disk -w 20% -c 10% -p /dev/sda3
command[check_zombie_procs]=/usr/local/nagios/libexec/check_procs -w 5 -c 10 -s Z
command[check_total_procs]=/usr/local/nagios/libexec/check_procs -w 150 -c 200
command[check_swap]=/usr/local/nagios/libexec/check_swap -w 20% -c 10%
command[check_http]=/usr/local/nagios/libexec/check_http -H 192.168.7.93
command[check_ssh]=/usr/local/nagios/libexec/check_ssh -H 192.168.7.93
command[check_mysql]=/usr/local/nagios/libexec/check_tcp -H 192.168.7.93 -p 3306
---------------------
注:這裡客戶端/usr/local/nagios/etc/nrpe.cfg內的command[check_mysql]與服務器端/usr/local/nagios/etc/object/services.cfg內的check_command check_nrpe!check_mysql
對應,services.cfg格式在服務器端/usr/local/nagios/etc/object/commands.cfg內有詳解.
---------------------
5、啟動NRPE
[root@web ~]# /usr/local/nagios/bin/nrpe -c /usr/local/nagios/etc/nrpe.cfg -d
重啟服務可用lsof -i:5666 查看PID,並kill -9 "PID",而後重復上述啟動命令.
//檢測nrep配置文件的正確性
#netstat -an | grep 5666 //是否監聽5666用於nrpe通信的端口
6、測試無法訪問,檢查一下IPtables是否關閉。
[root@web ~]# service iptables status
添加nrpe 5666端口:
[root@web ~]# vim /etc/sysconfig/iptables
-A INPUT -m state --state NEW -m tcp -p tcp --dport 5666 -j ACCEPT
[root@web ~]# service iptables restart
7、在服務端監控端執行檢測工作站nrpe信息
[root@nagios ~]# /usr/local/nagios/libexec/check_nrpe -H 192.168.7.93
NRPE v2.14
8、查看nrpe進程
[root@localhost ~]# ps -elf |grep nrpe
[root@web ~]# ps -elf |grep nrpe
5 S nagios 1480 1 0 80 0 - 9708 poll_s Mar14 ? 00:00:00 /usr/local/nagios/bin/nrpe -c /usr/local/nagios/etc/nrpe.cfg -d
0 S root 1611 1437 0 80 0 - 25809 pipe_w 00:40 pts/0 00:00:00 grep nrpe
9、登錄到WEB界面
修改密碼:
htpasswd -c /usr/local/nagios/htpasswd.users nagiosadmin
輸入密碼123456
http://192.168.7.249/nagios/
輸入用戶名密碼:
nagiosadmin 123456
點擊Services:
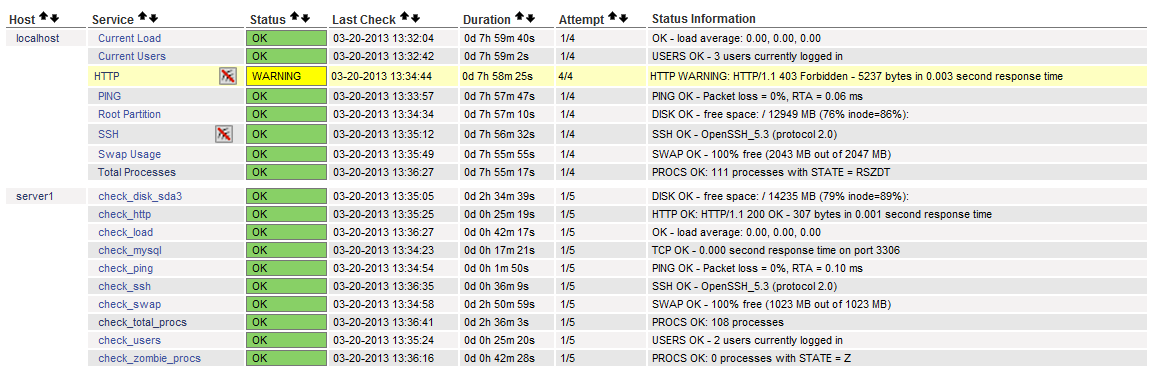
至此大功告成...
注: nrpe 提示Connection refused by host
在centos6.3 x64上安裝nagios的nrpe服務,當nrpe順利安裝完成之後,執行/usr/local/nagios/libexec/check_nrpe -H localhost,提示Connection refused by host
解決方法:
啟動NRPE
[root@web ~]# /usr/local/nagios/bin/nrpe -c /usr/local/nagios/etc/nrpe.cfg -d
然後執行,netstat -an | grep 5666
顯示:tcp 0 0 127.0.0.1:5666 0.0.0.0:* LISTEN
則啟動成功。
然後再執行:/usr/local/nagios/libexec/check_nrpe -H localhost
返回:NRPE v2.14
進階:
----監控內存----
【客戶端】
1、添加腳本:
vi check_mem.sh
-----------------
TOTAL=`free -m | head -2 |tail -1 |gawk '{print $2}'`
# Free memory
FREE=`free -m | head -2 |tail -1 |gawk '{print $4}'`
# to calculate free percent
# use the expression free * 100 / total
FREETMP=`expr $FREE \* 100`
PERCENT=`expr $FREETMP / $TOTAL`
echo "$FREE MB ($PERCENT%) Free Memory"
exit 0
-------------------------
並且把該腳本復制到/usr/local/nagios/libexec,賦予執行權限,屬主改為nagios
#cp check_mem.sh /usr/local/nagios/libexec
#chmod u+x check_mem.sh
#chown nagios check_mem.sh
2、修改配置文件:
vi /usr/local/nagios/etc/nrpe.cfg
添加:
command[check_mem]=/usr/local/nagios/libexec/check_mem.sh -w 150 -c 100
3、在客戶端測試腳本,
# ./check_mem.sh
200 MB (1%) Free Memory
4.重啟服務
[root@server1 libexec]# lsof -i:5666
COMMAND PID USER FD TYPE DEVICE SIZE/OFF NODE NAME
nrpe 4457 nagios 4u IPv4 485359 0t0 TCP *:5666 (LISTEN)
[root@server1 libexec]# kill -9 4457
[root@server1 libexec]# /usr/local/nagios/bin/nrpe -c /usr/local/nagios/etc/nrpe.cfg -d
【服務器端】
1.添加監控模塊:
vi /usr/local/nagios/etc/object/services.cfg
添加:
--------
define service{
host_name server1
service_description check_mem
check_command check_nrpe!check_mem
max_check_attempts 5
normal_check_interval 3
retry_check_interval 2
check_period 24x7
notification_interval 10
notification_period 24x7
notification_options w,u,c,r
}
---------
2.重啟服務
service nagios restart
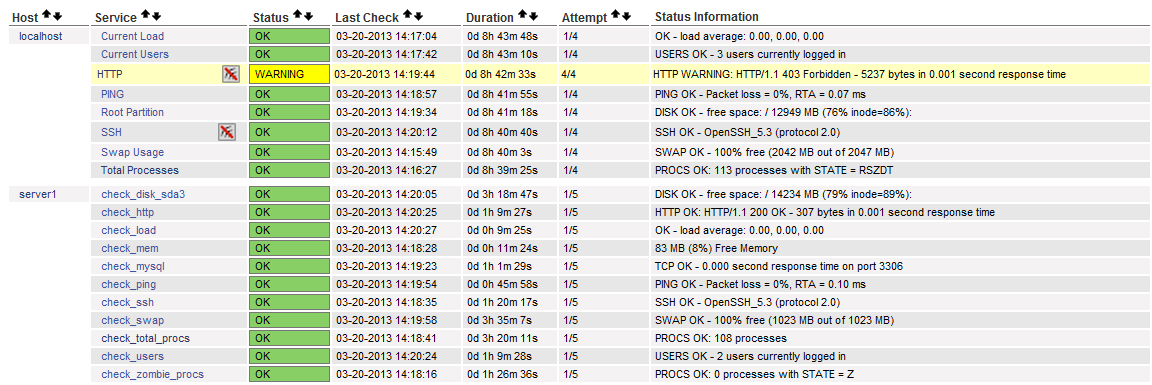
3.訪問http://192.168.7.249/nagios/
如圖
本文出自 “一路向北” 博客,請務必保留此出處http://showerlee.blog.51cto.com/2047005/1158125