


一、Nagios簡介

Nagios是一款開源的電腦系統和網絡監視工具,能有效監控Windows、Linux和Unix的主機狀態,交換機路由器等網絡設置,打印機等。在系統或服務狀態異常時發出郵件或短信報警第一時間通知網站運維人員,在狀態恢復後發出正常的郵件或短信通知。
Nagios原名為NetSaint,由Ethan Galstad開發並維護至今。NAGIOS是一個縮寫形式: "Nagios Ain't Gonna Insist On Sainthood" Sainthood 翻譯為聖徒,而"Agios"是"saint"的希臘表示方法。Nagios被開發在Linux下使用,但在Unix下也工作得非常好。
主要功能
網絡服務監控(SMTP、POP3、HTTP、NNTP、ICMP、SNMP、FTP、SSH)主機資源監控(CPU load、disk usage、system logs),也包括Windows主機(使用NSClient++ plugin)可以指定自己編寫的Plugin通過網絡收集數據來監控任何情況(溫度、警告……)可以通過配置Nagios遠程執行插件遠程執行腳本遠程監控支持SSH或SSL加通道方式進行監控簡單的plugin設計允許用戶很容易的開發自己需要的檢查服務,支持很多開發語言(shell scripts、C++、Perl、ruby、Python、PHP、C#等)包含很多圖形化數據Plugins(Nagiosgraph、Nagiosgrapher、PNP4Nagios等)可並行服務檢查能夠定義網絡主機的層次,允許逐級檢查,就是從父主機開始向下檢查當服務或主機出現問題時發出通告,可通過email, pager, sms 或任意用戶自定義的plugin進行通知能夠自定義事件處理機制重新激活出問題的服務或主機自動日志循環支持冗余監控包括Web界面可以查看當前網絡狀態,通知,問題歷史,日志文件等二、Nagios工作原理
Nagios的功能是監控服務和主機,但是他自身並不包括這部分功能,所有的監控、檢測功能都是通過各種插件來完成的。
啟動Nagios後,它會周期性的自動調用插件去檢測服務器狀態,同時Nagios會維持一個隊列,所有插件返回來的狀態信息都進入隊列,Nagios每次都從隊首開始讀取信息,並進行處理後,把狀態結果通過web顯示出來。
Nagios提供了許多插件,利用這些插件可以方便的監控很多服務狀態。安裝完成後,在nagios主目錄下的/libexec裡放有nagios自帶的可以使用的所有插件,如,check_disk是檢查磁盤空間的插件,check_load是檢查CPU負載的,等等。每一個插件可以通過運行./check_xxx –h 來查看其使用方法和功能。
Nagios可以識別4種狀態返回信息,即 0(OK)表示狀態正常/綠色、1(WARNING)表示出現警告/黃色、2(CRITICAL)表示出現非常嚴重的錯誤/紅色、3(UNKNOWN)表示未知錯誤/深黃色。Nagios根據插件返回來的值,來判斷監控對象的狀態,並通過web顯示出來,以供管理員及時發現故障。
四種監控狀態

再說報警功能,如果監控系統發現問題不能報警那就沒有意義了,所以報警也是nagios很重要的功能之一。但是,同樣的,Nagios 自身也沒有報警部分的代碼,甚至沒有插件,而是交給用戶或者其他相關開源項目組去完成的。
Nagios 安裝,是指基本平台,也就是Nagios軟件包的安裝。它是監控體系的框架,也是所有監控的基礎。
打開Nagios官方的文檔,會發現Nagios基本上沒有什麼依賴包,只要求系統是Linux或者其他Nagios支持的系統。不過如果你沒有安裝apache(http服務),那麼你就沒有那麼直觀的界面來查看監控信息了,所以apache姑且算是一個前提條件。關於apache的安裝,網上有很多,照著安裝就是了。安裝之後要檢查一下是否可以正常工作。
知道Nagios 是如何通過插件來管理服務器對象後,現在開始研究它是如何管理遠端服務器對象的。Nagios 系統提供了一個插件NRPE。Nagios 通過周期性的運行它來獲得遠端服務器的各種狀態信息。它們之間的關系如下圖所示:

Nagios 通過NRPE 來遠端管理服務
1. Nagios 執行安裝在它裡面的check_nrpe 插件,並告訴check_nrpe 去檢測哪些服務。
2. 通過SSL,check_nrpe 連接遠端機子上的NRPE daemon
3. NRPE 運行本地的各種插件去檢測本地的服務和狀態(check_disk,..etc)
4. 最後,NRPE 把檢測的結果傳給主機端的check_nrpe,check_nrpe 再把結果送到Nagios狀態隊列中。
5. Nagios 依次讀取隊列中的信息,再把結果顯示出來。
三、實驗環境
Host Name OS IP Software Nagios-Server CentOS release 6.3 (Final) 192.168.1.108 Apache、Php、Nagios、nagios-plugins Nagios-Linux CentOS release 5.8 (Final) 192.168.1.111 nagios-plugins、nrpe Nagios-Windows Windows XP 192.168.1.113 NSClient++Server 安裝了nagios軟件,對監控的數據做處理,並且提供web界面查看和管理。當然也可以對本機自身的信息進行監控。
Client 安裝了NRPE等客戶端,根據監控機的請求執行監控,然後將結果回傳給監控機。
防火牆已關閉/iptables: Firewall is not running.
SELINUX=disabled
四、實驗目標
五、Nagios服務端安裝
5.1 基礎支持套件:gcc glibc glibc-common gd gd-devel xinetd openssl-devel
# rpm -q gcc glibc glibc-common gd gd-devel xinetd openssl-devel

如果系統中沒有這些套件,使用yum 安裝
# yum install -y gcc glibc glibc-common gd gd-devel xinetd openssl-devel
5.2 創建nagios用戶和用戶組
# useradd -s /sbin/nologin nagios
# mkdir /usr/local/nagios
# chown -R nagios.nagios /usr/local/nagios

查看nagios 目錄的權限
# ll -d /usr/local/nagios/

5.3 編譯安裝Nagios
# wget http://prdownloads.sourceforge.net/sourceforge/nagios/nagios-3.4.3.tar.gz
# tar zxvf nagios-3.4.3.tar.gz
# cd nagios
# ./configure --prefix=/usr/local/nagios


# make all


# make install

# make install-init

# make install-commandmode

# make install-config

# chkconfig --add nagios
# chkconfig --level 35 nagios on
# chkconfig --list nagios

5.4 驗證程序是否被正確安裝
切換目錄到安裝路徑(這裡是/usr/local/nagios),看是否存在etc、bin、sbin、share、var 這五個目錄,如果存在則可以表明程序被正確的安裝到系統了。Nagios 各個目錄用途說明如下:
bin Nagios 可執行程序所在目錄 etc Nagios 配置文件所在目錄 sbin Nagios CGI 文件所在目錄,也就是執行外部命令所需文件所在的目錄 share Nagios網頁文件所在的目錄 libexec Nagios 外部插件所在目錄 var Nagios 日志文件、lock 等文件所在的目錄 var/archives Nagios 日志自動歸檔目錄 var/rw 用來存放外部命令文件的目錄5.5 安裝Nagios 插件
# wget http://prdownloads.sourceforge.net/sourceforge/nagiosplug/nagios-plugins-1.4.16.tar.gz
# tar zxvf nagios-plugins-1.4.16.tar.gz
# cd nagios-plugins-1.4.16
# ./configure --prefix=/usr/local/nagios
# make && make install


5.6 安裝與配置Apache和Php
Apache 和Php 不是安裝nagios 所必須的,但是nagios提供了web監控界面,通過web監控界面可以清晰的看到被監控主機、資源的運行狀態,因此,安裝一個web服務是很必要的。
需要注意的是,nagios在nagios3.1.x版本以後,配置web監控界面時需要php的支持。這裡我們下載的nagios版本為nagios-3.4.3,因此在編譯安裝完成apache後,還需要編譯php模塊,這裡選取的php版本為php5.4.10。
a. 安裝Apache
# wget http://archive.apache.org/dist/httpd/httpd-2.2.23.tar.gz
# tar zxvf httpd-2.2.23.tar.gz
# cd httpd-2.2.23
# ./configure --prefix=/usr/local/apache2
# make && make install

若出現錯誤:
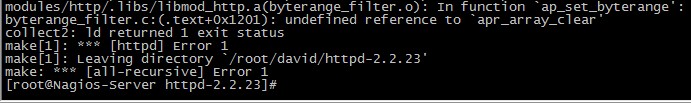
則在編譯時入加 --with-included-apr 即可解決。
b. 安裝Php
# wget http://cn2.php.net/distributions/php-5.4.10.tar.gz
# tar zxvf php-5.4.10.tar.gz
# cd php-5.4.10
# ./configure --prefix=/usr/local/php --with-apxs2=/usr/local/apache2/bin/apxs

# make && make install

c. 配置apache
找到apache 的配置文件/usr/local/apache2/conf/httpd.conf
找到:
User daemon
Group daemon
修改為
User nagios
Group nagios
然後找到
DirectoryIndex index.html
修改為
DirectoryIndex index.html index.php
接著增加如下內容:
AddType application/x-httpd-php .php
為了安全起見,一般情況下要讓nagios 的web 監控頁面必須經過授權才能訪問,這需要增加驗證配置,即在httpd.conf 文件最後添加如下信息:

#setting for nagios ScriptAlias /nagios/cgi-bin "/usr/local/nagios/sbin"AuthType Basic Options ExecCGI AllowOverride None Order allow,deny Allow from all AuthName "Nagios Access" AuthUserFile /usr/local/nagios/etc/htpasswd //用於此目錄訪問身份驗證的文件 Require valid-user Alias /nagios "/usr/local/nagios/share"AuthType Basic Options None AllowOverride None Order allow,deny Allow from all AuthName "nagios Access" AuthUserFile /usr/local/nagios/etc/htpasswd Require valid-user
d. 創建apache目錄驗證文件
在上面的配置中,指定了目錄驗證文件htpasswd,下面要創建這個文件:
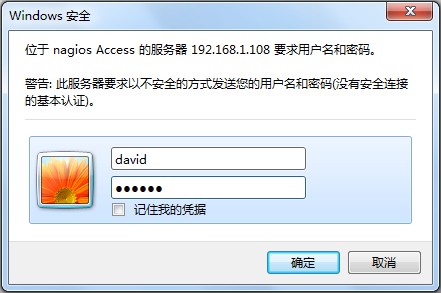
# /usr/local/apache2/bin/htpasswd -c /usr/local/nagios/etc/htpasswd david

這樣就在/usr/local/nagios/etc 目錄下創建了一個htpasswd 驗證文件,當通過http://192.168.1.108/nagios/ 訪問時就需要輸入用戶名和密碼了。
e. 查看認證文件的內容
# cat /usr/local/nagios/etc/htpasswd

f. 啟動apache 服務
# /usr/local/apache2/bin/apachectl start
到這裡nagios 的安裝也就基本完成了,你可以通過web來訪問了。
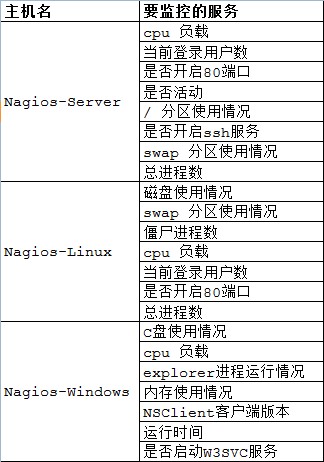
六、配置Nagios
Nagios 主要用於監控一台或者多台本地主機及遠程的各種信息,包括本機資源及對外的服務等。默認的Nagios 配置沒有任何監控內容,僅是一些模板文件。若要讓Nagios 提供服務,就必須修改配置文件,增加要監控的主機和服務,下面將詳細介紹。
6.1 默認配置文件介紹
Nagios 安裝完畢後,默認的配置文件在/usr/local/nagios/etc目錄下。

每個文件或目錄含義如下表所示:
文件名或目錄名 用途 cgi.cfg 控制CGI訪問的配置文件 nagios.cfg Nagios 主配置文件 resource.cfg 變量定義文件,又稱為資源文件,在些文件中定義變量,以便由其他配置文件引用,如$USER1$ objects objects 是一個目錄,在此目錄下有很多配置文件模板,用於定義Nagios 對象 objects/commands.cfg 命令定義配置文件,其中定義的命令可以被其他配置文件引用 objects/contacts.cfg 定義聯系人和聯系人組的配置文件 objects/localhost.cfg 定義監控本地主機的配置文件 objects/printer.cfg 定義監控打印機的一個配置文件模板,默認沒有啟用此文件 objects/switch.cfg 定義監控路由器的一個配置文件模板,默認沒有啟用此文件 objects/templates.cfg 定義主機和服務的一個模板配置文件,可以在其他配置文件中引用 objects/timeperiods.cfg 定義Nagios 監控時間段的配置文件 objects/windows.cfg 監控Windows 主機的一個配置文件模板,默認沒有啟用此文件6.2 配置文件之間的關系
在nagios的配置過程中涉及到的幾個定義有:主機、主機組,服務、服務組,聯系人、聯系人組,監控時間,監控命令等,從這些定義可以看出,nagios各個配置文件之間是互為關聯,彼此引用的。
成功配置出一台nagios監控系統,必須要弄清楚每個配置文件之間依賴與被依賴的關系,最重要的有四點:
第一:定義監控哪些主機、主機組、服務和服務組;
第二:定義這個監控要用什麼命令實現;
第三:定義監控的時間段;
第四:定義主機或服務出現問題時要通知的聯系人和聯系人組。
6.3 配置Nagios
為了能更清楚的說明問題,同時也為了維護方便,建議將nagios各個定義對象創建獨立的配置文件:
創建hosts.cfg文件來定義主機和主機組 創建services.cfg文件來定義服務 用默認的contacts.cfg文件來定義聯系人和聯系人組 用默認的commands.cfg文件來定義命令 用默認的timeperiods.cfg來定義監控時間段 用默認的templates.cfg文件作為資源引用文件a. templates.cfg文件
nagios主要用於監控主機資源以及服務,在nagios配置中稱為對象,為了不必重復定義一些監控對象,Nagios引入了一個模板配置文件,將一些共性的屬性定義成模板,以便於多次引用。這就是templates.cfg的作用。
下面詳細介紹下templates.cfg文件中每個參數的含義:
define contact{
        name                            generic-contact    ; 聯系人名稱
        service_notification_period     24x7               ; 當服務出現異常時,發送通知的時間段,這個時間段"24x7"在timeperiods.cfg文件中定義
        host_notification_period        24x7               ; 當主機出現異常時,發送通知的時間段,這個時間段"24x7"在timeperiods.cfg文件中定義
        service_notification_options    w,u,c,r            ; 這個定義的是“通知可以被發出的情況”。w即warn,表示警告狀態,u即unknown,表示不明狀態;
                                                           ; c即criticle,表示緊急狀態,r即recover,表示恢復狀態;
                                                           ; 也就是在服務出現警告狀態、未知狀態、緊急狀態和重新恢復狀態時都發送通知給使用者。
        host_notification_options       d,u,r                   ; 定義主機在什麼狀態下需要發送通知給使用者,d即down,表示宕機狀態;
                                                                ; u即unreachable,表示不可到達狀態,r即recovery,表示重新恢復狀態。
        service_notification_commands   notify-service-by-email ; 服務故障時,發送通知的方式,可以是郵件和短信,這裡發送的方式是郵件;
                                                                ; 其中“notify-service-by-email”在commands.cfg文件中定義。
        host_notification_commands      notify-host-by-email    ; 主機故障時,發送通知的方式,可以是郵件和短信,這裡發送的方式是郵件;
                                                                ; 其中“notify-host-by-email”在commands.cfg文件中定義。
        register                        0                    ; DONT REGISTER THIS DEFINITION - ITS NOT A REAL CONTACT, JUST A TEMPLATE!
        }
define host{
        name                            generic-host    ; 主機名稱,這裡的主機名,並不是直接對應到真正機器的主機名;
                                                        ; 乃是對應到在主機配置文件裡所設定的主機名。
        notifications_enabled           1               ; Host notifications are enabled
        event_handler_enabled           1               ; Host event handler is enabled
        flap_detection_enabled          1               ; Flap detection is enabled
        failure_prediction_enabled      1               ; Failure prediction is enabled
        process_perf_data               1               ; 其值可以為0或1,其作用為是否啟用Nagios的數據輸出功能;
                                                        ; 如果將此項賦值為1,那麼Nagios就會將收集的數據寫入某個文件中,以備提取。
        retain_status_information       1               ; Retain status information across program restarts
        retain_nonstatus_information    1               ; Retain non-status information across program restarts
        notification_period             24x7            ; 指定“發送通知”的時間段,也就是可以在什麼時候發送通知給使用者。
        register                        0               ; DONT REGISTER THIS DEFINITION - ITS NOT A REAL HOST, JUST A TEMPLATE!
        }
define host{
        name                            linux-server    ; 主機名稱
        use                             generic-host    ; use表示引用,也就是將主機generic-host的所有屬性引用到linux-server中來;
                                                        ; 在nagios配置中,很多情況下會用到引用。
        check_period                    24x7            ; 這裡的check_period告訴nagios檢查主機的時間段
        check_interval                  5               ; nagios對主機的檢查時間間隔,這裡是5分鐘。
        retry_interval                  1               ; 重試檢查時間間隔,單位是分鐘。
        max_check_attempts              10              ; nagios對主機的最大檢查次數,也就是nagios在檢查發現某主機異常時,並不馬上判斷為異常狀況;
                                                        ; 而是多試幾次,因為有可能只是一時網絡太擁擠,或是一些其他原因,讓主機受到了一點影響;
                                                        ; 這裡的10就是最多試10次的意思。
        check_command                   check-host-alive ; 指定檢查主機狀態的命令,其中“check-host-alive”在commands.cfg文件中定義。
        notification_period             24x7            ; 主機故障時,發送通知的時間范圍,其中“workhours”在timeperiods.cfg中進行了定義;
                                                        ; 下面會陸續講到。
        notification_interval           10              ; 在主機出現異常後,故障一直沒有解決,nagios再次對使用者發出通知的時間。單位是分鐘;
                                                        ; 如果你覺得,所有的事件只需要一次通知就夠了,可以把這裡的選項設為0
        notification_options            d,u,r           ; 定義主機在什麼狀態下可以發送通知給使用者,d即down,表示宕機狀態;
                                                        ; u即unreachable,表示不可到達狀態;
                                                        ; r即recovery,表示重新恢復狀態。
        contact_groups                  ts              ; 指定聯系人組,這個“admins”在contacts.cfg文件中定義。
        register                        0               ; DONT REGISTER THIS DEFINITION - ITS NOT A REAL HOST, JUST A TEMPLATE!
        }
define host{
        name                    windows-server  ; The name of this host template
        use                     generic-host    ; Inherit default values from the generic-host template
        check_period            24x7            ; By default, Windows servers are monitored round the clock
        check_interval          5               ; Actively check the server every 5 minutes
        retry_interval          1               ; Schedule host check retries at 1 minute intervals
        max_check_attempts      10              ; Check each server 10 times (max)
        check_command           check-host-alive        ; Default command to check if servers are "alive"
        notification_period     24x7            ; Send notification out at any time - day or night
        notification_interval   10              ; Resend notifications every 30 minutes
        notification_options    d,r             ; Only send notifications for specific host states
        contact_groups          ts              ; Notifications get sent to the admins by default
        hostgroups              windows-servers ; Host groups that Windows servers should be a member of
        register                0               ; DONT REGISTER THIS - ITS JUST A TEMPLATE
        }
define service{
        name                            generic-service         ; 定義一個服務名稱
        active_checks_enabled           1                       ; Active service checks are enabled
        passive_checks_enabled          1                       ; Passive service checks are enabled/accepted
        parallelize_check               1                       ; Active service checks should be parallelized;
                                                                ; (disabling this can lead to major performance problems)
        obsess_over_service             1                       ; We should obsess over this service (if necessary)
        check_freshness                 0                       ; Default is to NOT check service 'freshness'
        notifications_enabled           1                       ; Service notifications are enabled
        event_handler_enabled           1                       ; Service event handler is enabled
        flap_detection_enabled          1                       ; Flap detection is enabled
        failure_prediction_enabled      1                       ; Failure prediction is enabled
        process_perf_data               1                       ; Process performance data
        retain_status_information       1                       ; Retain status information across program restarts
        retain_nonstatus_information    1                       ; Retain non-status information across program restarts
        is_volatile                     0                       ; The service is not volatile
        check_period                    24x7             ; 這裡的check_period告訴nagios檢查服務的時間段。
        max_check_attempts              3                ; nagios對服務的最大檢查次數。
        normal_check_interval           5                ; 此選項是用來設置服務檢查時間間隔,也就是說,nagios這一次檢查和下一次檢查之間所隔的時間;
                                                         ; 這裡是5分鐘。
        retry_check_interval            2                ; 重試檢查時間間隔,單位是分鐘。
        contact_groups                  ts           ; 指定聯系人組
        notification_options            w,u,c,r          ; 這個定義的是“通知可以被發出的情況”。w即warn,表示警告狀態;
                                                         ; u即unknown,表示不明狀態;
                                                         ; c即criticle,表示緊急狀態,r即recover,表示恢復狀態;
                                                         ; 也就是在服務出現警告狀態、未知狀態、緊急狀態和重新恢復後都發送通知給使用者。
        notification_interval           10               ; Re-notify about service problems every hour
        notification_period             24x7             ; 指定“發送通知”的時間段,也就是可以在什麼時候發送通知給使用者。
        register                        0                ; DONT REGISTER THIS DEFINITION - ITS NOT A REAL SERVICE, JUST A TEMPLATE!
        }
define service{
        name                            local-service           ; The name of this service template
        use                             generic-service         ; Inherit default values from the generic-service definition
        max_check_attempts              4             ; Re-check the service up to 4 times in order to determine its final (hard) state
        normal_check_interval           5             ; Check the service every 5 minutes under normal conditions
        retry_check_interval            1             ; Re-check the service every minute until a hard state can be determined
        register                        0             ; DONT REGISTER THIS DEFINITION - ITS NOT A REAL SERVICE, JUST A TEMPLATE!
        }
b. resource.cfg文件
resource.cfg是nagios的變量定義文件,文件內容只有一行:
$USER1$=/usr/local/nagios/libexec
其中,變量$USER1$指定了安裝nagios插件的路徑,如果把插件安裝在了其它路徑,只需在這裡進行修改即可。需要注意的是,變量必須先定義,然後才能在其它配置文件中進行引用。
c. commands.cfg文件
此文件默認是存在的,無需修改即可使用,當然如果有新的命令需要加入時,在此文件進行添加即可。
#notify-host-by-email命令的定義
define command{
        command_name    notify-host-by-email             #命令名稱,即定義了一個主機異常時發送郵件的命令。
        command_line    /usr/bin/printf "%b" "***** Nagios *****\n\nNotification Type: $NOTIFICATIONTYPE$\nHost: $HOSTNAME$\nState: $HOSTSTATE$\nAddress: $HOSTADDRESS$\nInfo: $HOSTOUTPUT$\n\nDate/Time: $LONGDATETIME$\n" | /bin/mail -s "** $NOTIFICATIONTYPE$ Host Alert: $HOSTNAME$ is $HOSTSTATE$ **" $CONTACTEMAIL$                                     #命令具體的執行方式。
        }
#notify-service-by-email命令的定義
define command{
        command_name    notify-service-by-email          #命令名稱,即定義了一個服務異常時發送郵件的命令
        command_line    /usr/bin/printf "%b" "***** Nagios *****\n\nNotification Type: $NOTIFICATIONTYPE$\n\nService: $SERVICEDESC$\nHost: $HOSTALIAS$\nAddress: $HOSTADDRESS$\nState: $SERVICESTATE$\n\nDate/Time: $LONGDATETIME$\n\nAdditional Info:\n\n$SERVICEOUTPUT$\n" | /bin/mail -s "** $NOTIFICATIONTYPE$ Service Alert: $HOSTALIAS$/$SERVICEDESC$ is $SERVICESTATE$ **" $CONTACTEMAIL$
        }
#check-host-alive命令的定義
define command{
        command_name    check-host-alive                 #命令名稱,用來檢測主機狀態。
        command_line    $USER1$/check_ping -H $HOSTADDRESS$ -w 3000.0,80% -c 5000.0,100% -p 5
                        # 這裡的變量$USER1$在resource.cfg文件中進行定義,即$USER1$=/usr/local/nagios/libexec;
                        # 那麼check_ping的完整路徑為/usr/local/nagios/libexec/check_ping;
                        # “-w 3000.0,80%”中“-w”說明後面的一對值對應的是“WARNING”狀態,“80%”是其臨界值。
                        # “-c 5000.0,100%”中“-c”說明後面的一對值對應的是“CRITICAL”,“100%”是其臨界值。
                        # “-p 1”說明每次探測發送一個包。
        }
define command{
        command_name    check_local_disk
        command_line    $USER1$/check_disk -w $ARG1$ -c $ARG2$ -p $ARG3$            #$ARG1$是指在調用這個命令的時候,命令後面的第一個參數。
        }
define command{
        command_name    check_local_load
        command_line    $USER1$/check_load -w $ARG1$ -c $ARG2$
        }
define command{
        command_name    check_local_procs
        command_line    $USER1$/check_procs -w $ARG1$ -c $ARG2$ -s $ARG3$
        }
define command{
        command_name    check_local_users
        command_line    $USER1$/check_users -w $ARG1$ -c $ARG2$
        }
define command{
        command_name    check_local_swap
        command_line    $USER1$/check_swap -w $ARG1$ -c $ARG2$
        }
define command{
        command_name    check_ftp
        command_line    $USER1$/check_ftp -H $HOSTADDRESS$ $ARG1$
        }
define command{
        command_name    check_http
        command_line    $USER1$/check_http -I $HOSTADDRESS$ $ARG1$
        }
define command{
        command_name    check_ssh
        command_line    $USER1$/check_ssh $ARG1$ $HOSTADDRESS$
        }
define command{
        command_name    check_ping
        command_line    $USER1$/check_ping -H $HOSTADDRESS$ -w $ARG1$ -c $ARG2$ -p 5
        }
define command{
        command_name    check_nt
        command_line    $USER1$/check_nt -H $HOSTADDRESS$ -p 12489 -v $ARG1$ $ARG2$
        }
d. hosts.cfg文件
此文件默認不存在,需要手動創建,hosts.cfg主要用來指定被監控的主機地址以及相關屬性信息,根據實驗目標配置如下:
define host{
        use                     linux-server          #引用主機linux-server的屬性信息,linux-server主機在templates.cfg文件中進行了定義。
        host_name               Nagios-Linux          #主機名
        alias                   Nagios-Linux          #主機別名
        address                 192.168.1.111         #被監控的主機地址,這個地址可以是ip,也可以是域名。
        }
#定義一個主機組
define hostgroup{
        hostgroup_name          bsmart-servers        #主機組名稱,可以隨意指定。
        alias                   bsmart servers        #主機組別名
        members                 Nagios-Linux          #主機組成員,其中“Nagios-Linux”就是上面定義的主機。
        }
注意:在/usr/local/nagios/etc/objects 下默認有localhost.cfg 和windows.cfg 這兩個配置文件,localhost.cfg 文件是定義監控主機本身的,windows.cfg 文件是定義windows 主機的,其中包括了對host 和相關services 的定義。所以在本次實驗中,將直接在localhost.cfg 中定義監控主機(Nagios-Server),在windows.cfg中定義windows 主機(Nagios-Windows)。根據自己的需要修改其中的相關配置,詳細如下:
localhost.cfg
define host{
        use                     linux-server            ; Name of host template to use
                                                        ; This host definition will inherit all variables that are defined
                                                        ; in (or inherited by) the linux-server host template definition.
        host_name               Nagios-Server
        alias                   Nagios-Server
        address                 127.0.0.1
        }
define hostgroup{
        hostgroup_name  linux-servers ; The name of the hostgroup
        alias           Linux Servers ; Long name of the group
        members         Nagios-Server ; Comma separated list of hosts that belong to this group
        }
define service{
        use                             local-service         ; Name of service template to use
        host_name                       Nagios-Server
        service_description             PING
        check_command                   check_ping!100.0,20%!500.0,60%
        }
define service{
        use                             local-service         ; Name of service template to use
        host_name                       Nagios-Server
        service_description             Root Partition
        check_command                   check_local_disk!20%!10%!/
        }
define service{
        use                             local-service         ; Name of service template to use
        host_name                       Nagios-Server
        service_description             Current Users
        check_command                   check_local_users!20!50
        }
define service{
        use                             local-service         ; Name of service template to use
        host_name                       Nagios-Server
        service_description             Total Processes
        check_command                   check_local_procs!250!400!RSZDT
        }
define service{
        use                             local-service         ; Name of service template to use
        host_name                       Nagios-Server
        service_description             Current Load
        check_command                   check_local_load!5.0,4.0,3.0!10.0,6.0,4.0
        }
define service{
        use                             local-service         ; Name of service template to use
        host_name                       Nagios-Server
        service_description             Swap Usage
        check_command                   check_local_swap!20!10
        }
define service{
        use                             local-service         ; Name of service template to use
        host_name                       Nagios-Server
        service_description             SSH
        check_command                   check_ssh
        notifications_enabled           0
        }
define service{
        use                             local-service         ; Name of service template to use
        host_name                       Nagios-Server
        service_description             HTTP
        check_command                   check_http
        notifications_enabled           0
        }
windows.cfg
define host{
        use             windows-server  ; Inherit default values from a template
        host_name       Nagios-Windows  ; The name we're giving to this host
        alias           My Windows Server       ; A longer name associated with the host
        address         192.168.1.113   ; IP address of the host
        }
define hostgroup{
        hostgroup_name  windows-servers ; The name of the hostgroup
        alias           Windows Servers ; Long name of the group
        }
define service{
        use                     generic-service
        host_name               Nagios-Windows
        service_description     NSClient++ Version
        check_command           check_nt!CLIENTVERSION
        }
define service{
        use                     generic-service
        host_name               Nagios-Windows
        service_description     Uptime
        check_command           check_nt!UPTIME
        }
define service{
        use                     generic-service
        host_name               Nagios-Windows
        service_description     CPU Load
        check_command           check_nt!CPULOAD!-l 5,80,90
        }
define service{
        use                     generic-service
        host_name               Nagios-Windows
        service_description     Memory Usage
        check_command           check_nt!MEMUSE!-w 80 -c 90
        }
define service{
        use                     generic-service
        host_name               Nagios-Windows
        service_description     C:\ Drive Space
        check_command           check_nt!USEDDISKSPACE!-l c -w 80 -c 90
        }
define service{
        use                     generic-service
        host_name               Nagios-Windows
        service_description     W3SVC
        check_command           check_nt!SERVICESTATE!-d SHOWALL -l W3SVC
        }
define service{
        use                     generic-service
        host_name               Nagios-Windows
        service_description     Explorer
        check_command           check_nt!PROCSTATE!-d SHOWALL -l Explorer.exe
        }
e. services.cfg文件
此文件默認也不存在,需要手動創建,services.cfg文件主要用於定義監控的服務和主機資源,例如監控http服務、ftp服務、主機磁盤空間、主機系統負載等等。Nagios-Server 和Nagios-Windows 相關服務已在相應的配置文件中定義,所以這裡只需要定義Nagios-Linux 相關服務即可,這裡只定義一個檢測是否存活的服務來驗證配置文件的正確性,其他服務的定義將在後面講到。
define service{
        use                     local-service          #引用local-service服務的屬性值,local-service在templates.cfg文件中進行了定義。
        host_name               Nagios-Linux           #指定要監控哪個主機上的服務,“Nagios-Server”在hosts.cfg文件中進行了定義。
        service_description     check-host-alive       #對監控服務內容的描述,以供維護人員參考。
        check_command           check-host-alive       #指定檢查的命令。
        }
f. contacts.cfg文件
contacts.cfg是一個定義聯系人和聯系人組的配置文件,當監控的主機或者服務出現故障,nagios會通過指定的通知方式(郵件或者短信)將信息發給這裡指定的聯系人或者使用者。
define contact{
        contact_name                    David             #聯系人的名稱,這個地方不要有空格
        use                             generic-contact   #引用generic-contact的屬性信息,其中“generic-contact”在templates.cfg文件中進行定義
        alias                           Nagios Admin
        email                           david.tang@bsmart.cn
        }
define contactgroup{
        contactgroup_name       ts                              #聯系人組的名稱,同樣不能空格
        alias                   Technical Support               #聯系人組描述
        members                 David                           #聯系人組成員,其中“david”就是上面定義的聯系人,如果有多個聯系人則以逗號相隔
        }
g. timeperiods.cfg文件
此文件只要用於定義監控的時間段,下面是一個配置好的實例:
#下面是定義一個名為24x7的時間段,即監控所有時間段
define timeperiod{
        timeperiod_name 24x7       #時間段的名稱,這個地方不要有空格
        alias           24 Hours A Day, 7 Days A Week
        sunday          00:00-24:00
        monday          00:00-24:00
        tuesday         00:00-24:00
        wednesday       00:00-24:00
        thursday        00:00-24:00
        friday          00:00-24:00
        saturday        00:00-24:00
        }
#下面是定義一個名為workhours的時間段,即工作時間段。
define timeperiod{
        timeperiod_name workhours
        alias           Normal Work Hours
        monday          09:00-17:00
        tuesday         09:00-17:00
        wednesday       09:00-17:00
        thursday        09:00-17:00
        friday          09:00-17:00
        }
h. cgi.cfg文件
此文件用來控制相關cgi腳本,如果想在nagios的web監控界面執行cgi腳本,例如重啟nagios進程、關閉nagios通知、停止nagios主機檢測等,這時就需要配置cgi.cfg文件了。
由於nagios的web監控界面驗證用戶為david,所以只需在cgi.cfg文件中添加此用戶的執行權限就可以了,需要修改的配置信息如下:
default_user_name=david
authorized_for_system_information=nagiosadmin,david
authorized_for_configuration_information=nagiosadmin,david
authorized_for_system_commands=david
authorized_for_all_services=nagiosadmin,david
authorized_for_all_hosts=nagiosadmin,david
authorized_for_all_service_commands=nagiosadmin,david
authorized_for_all_host_commands=nagiosadmin,david
i. nagios.cfg文件
nagios.cfg默認的路徑為/usr/local/nagios/etc/nagios.cfg,是nagios的核心配置文件,所有的對象配置文件都必須在這個文件中進行定義才能發揮其作用,這裡只需將對象配置文件在Nagios.cfg文件中進行引用即可。
log_file=/usr/local/nagios/var/nagios.log                  # 定義nagios日志文件的路徑
cfg_file=/usr/local/nagios/etc/objects/commands.cfg        # “cfg_file”變量用來引用對象配置文件,如果有更多的對象配置文件,在這裡依次添加即可。
cfg_file=/usr/local/nagios/etc/objects/contacts.cfg
cfg_file=/usr/local/nagios/etc/objects/hosts.cfg
cfg_file=/usr/local/nagios/etc/objects/services.cfg
cfg_file=/usr/local/nagios/etc/objects/timeperiods.cfg
cfg_file=/usr/local/nagios/etc/objects/templates.cfg
cfg_file=/usr/local/nagios/etc/objects/localhost.cfg       # 本機配置文件
cfg_file=/usr/local/nagios/etc/objects/windows.cfg         # windows 主機配置文件
object_cache_file=/usr/local/nagios/var/objects.cache      # 該變量用於指定一個“所有對象配置文件”的副本文件,或者叫對象緩沖文件
precached_object_file=/usr/local/nagios/var/objects.precache
resource_file=/usr/local/nagios/etc/resource.cfg           # 該變量用於指定nagios資源文件的路徑,可以在nagios.cfg中定義多個資源文件。
status_file=/usr/local/nagios/var/status.dat               # 該變量用於定義一個狀態文件,此文件用於保存nagios的當前狀態、注釋和宕機信息等。
status_update_interval=10                                  # 該變量用於定義狀態文件(即status.dat)的更新時間間隔,單位是秒,最小更新間隔是1秒。
nagios_user=nagios                                         # 該變量指定了Nagios進程使用哪個用戶運行。
nagios_group=nagios                                        # 該變量用於指定Nagios使用哪個用戶組運行。
check_external_commands=1                                  # 該變量用於設置是否允許nagios在web監控界面運行cgi命令;
                                                           # 也就是是否允許nagios在web界面下執行重啟nagios、停止主機/服務檢查等操作;
                                                           # “1”為運行,“0”為不允許。
command_check_interval=10s                                 # 該變量用於設置nagios對外部命令檢測的時間間隔,如果指定了一個數字加一個"s"(如10s);
                                                           # 那麼外部檢測命令的間隔是這個數值以秒為單位的時間間隔;
                                                           # 如果沒有用"s",那麼外部檢測命令的間隔是以這個數值的“時間單位”的時間間隔。
interval_length=60                                         # 該變量指定了nagios的時間單位,默認值是60秒,也就是1分鐘;
                                                           # 即在nagios配置中所有的時間單位都是分鐘。
6.4 驗證Nagios 配置文件的正確性
Nagios 在驗證配置文件方面做的非常到位,只需通過一個命令即可完成:
# /usr/local/nagios/bin/nagios -v /usr/local/nagios/etc/nagios.cfg
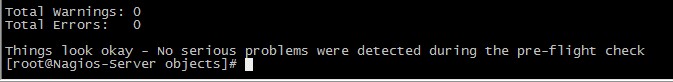 Nagios提供的這個驗證功能非常有用,在錯誤信息中通常會打印出錯誤的配置文件以及文件中的哪一行,這使得nagios的配置變得非常容易,報警信息通常是可以忽略的,因為一般那些只是建議性的。
看到上面這些信息就說明沒問題了,然後啟動Nagios 服務。
七、Nagios的啟動與停止7.1 啟動Nagios
a. 通過初始化腳本啟動nagios
# /etc/init.d/nagios start
or
# service nagios start
b. 手工方式啟動nagios
通過nagios命令的“-d”參數來啟動nagios守護進程:# /usr/local/nagios/bin/nagios -d /usr/local/nagios/etc/nagios.cfg
7.2 重啟Nagios
當修改了配置文件讓其生效時,需要重啟/重載Nagios服務。
a. 通過初始化腳本來重啟nagios
# /etc/init.d/nagios reload
or
# /etc/init.d/nagios restart
or
# service nagios restart
b. 通過web監控頁重啟nagios
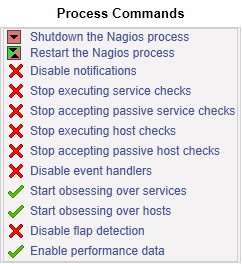
可以通過web監控頁的 "Process Info" -> "Restart the Nagios process"來重啟nagios
c. 手工方式平滑重啟
# kill -HUP
7.3 停止Nagios
a. 通過初始化腳本關閉nagios服務
# /etc/init.d/nagios stop
or
# service nagios stop
b. 通過web監控頁停止nagios
可以通過web監控頁的 "Process Info" -> "Shutdown the Nagios process"來停止nagios

c. 手工方式停止Nagios
# kill
八、查看初步配置情況
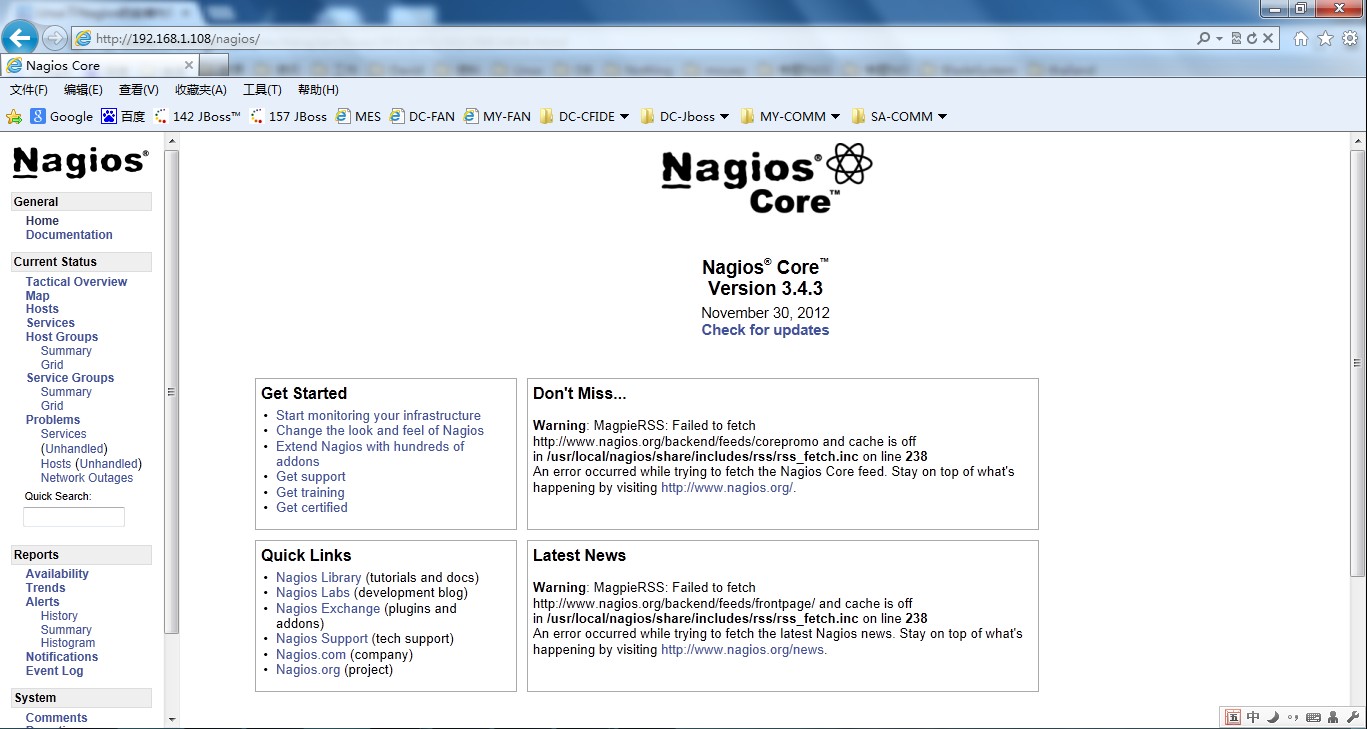
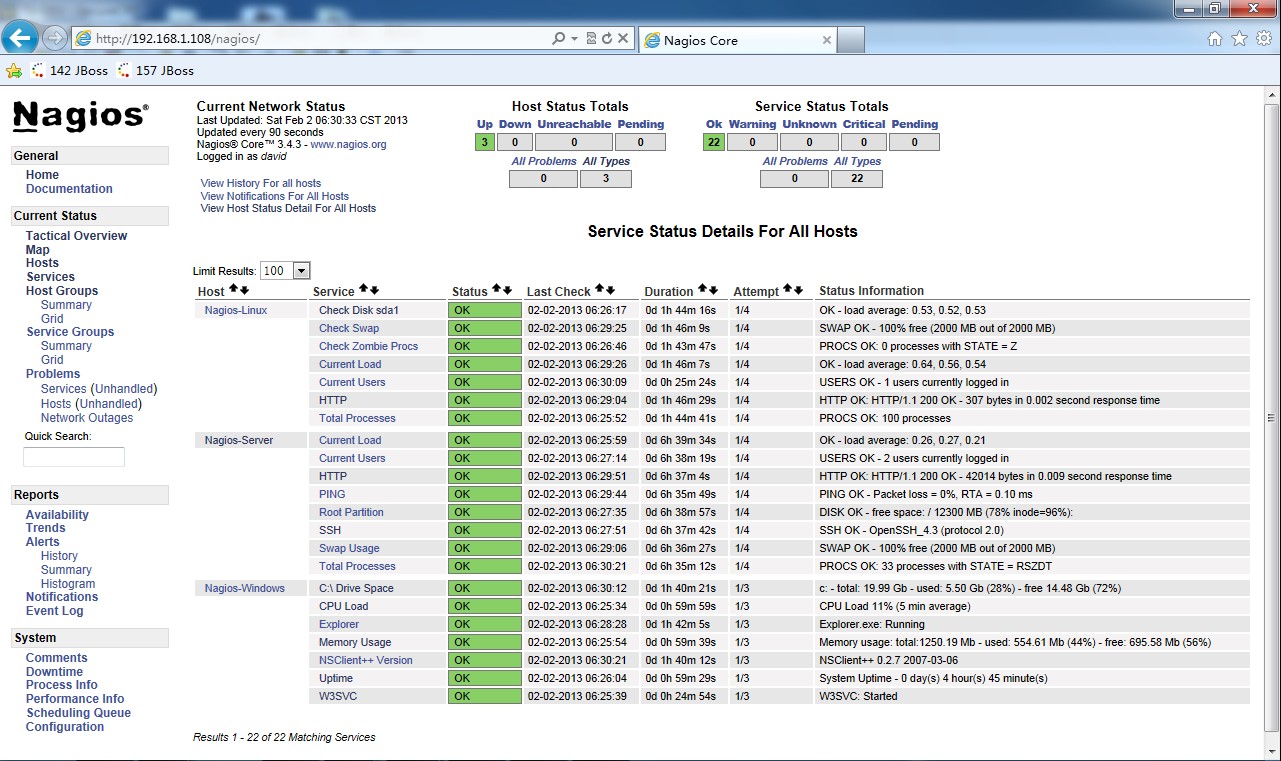
8.1 啟動完成之後,登錄Nagios Web監控頁http://192.168.1.108/nagios/ 查看相關信息。
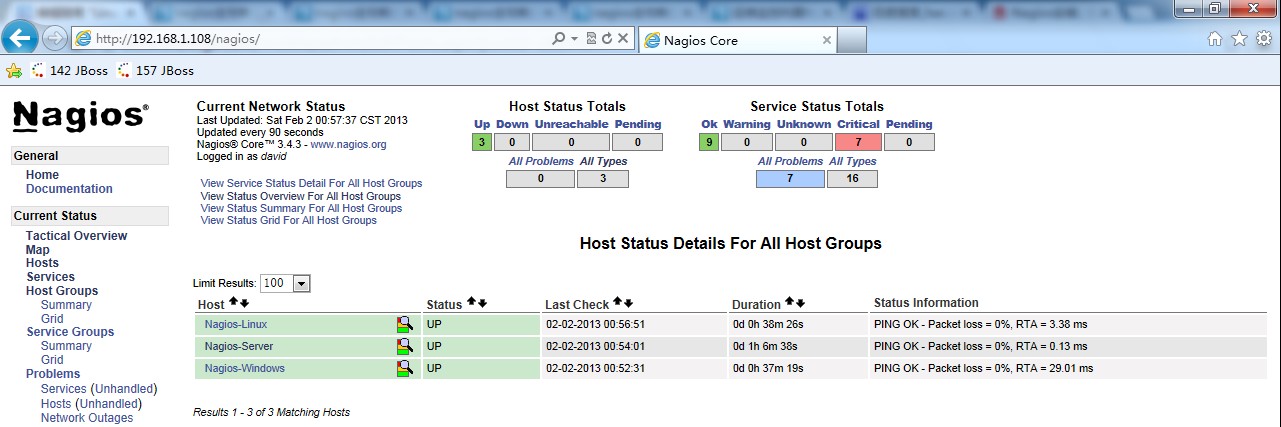
8.2 點擊左面的Current Status -> Hosts 可以看到所定義的三台主機已經全部UP了。
8.3 點擊Current Status -> Services 查看服務監控情況。
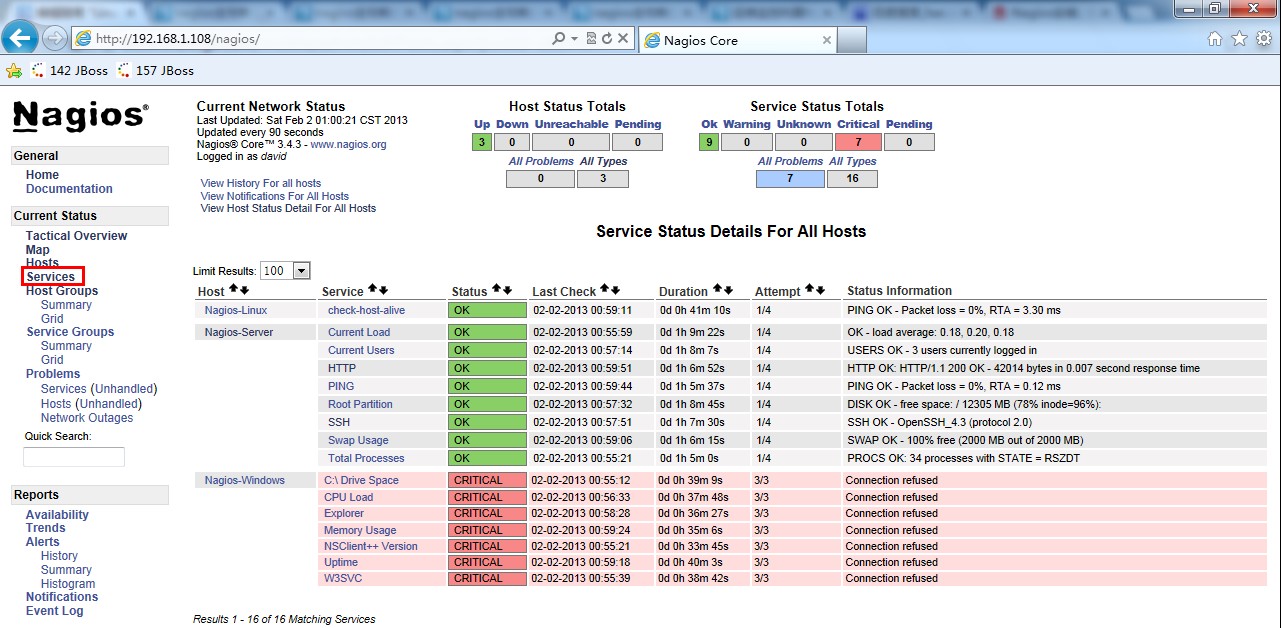
看到Nagios-Linux和Nagios-Server的服務狀態已經OK了,但是Nagios-Windows的服務狀態為CRITICAL,Status Information 提示Connection refused。因為Nagios-Windows上還未安裝插件,內部服務還無法查看,所以出現這種情況。將在下面具體講解。
九、利用NRPE監控遠程Linux上的“本地信息”
上面已經對遠程Linux 主機是否存活做了監控,而判斷遠程機器是否存活,我們可以使用ping 工具對其監測。還有一些遠程主機服務,例如ftp、ssh、http,都是對外開放的服務,即使不用Nagios,我們也可以試的出來,隨便找一台機器看能不能訪問這些服務就行了。但是對於像磁盤容量,cpu負載這樣的“本地信息”,Nagios只能監測自己所在的主機,而對其他的機器則顯得有點無能為力。畢竟沒得到被控主機的適當權限是不可能得到這些信息的。為了解決這個問題,nagios有這樣一個附加組件--“NRPE”,用它就可以完成對Linux 類型主機"本地信息”的監控。
9.1 NRPE 工作原理

按照上圖,整個的監控過程如下:
當Nagios 需要監控某個遠程Linux 主機的服務或者資源情況時:
Nagios 會運行check_nrpe 這個插件,告訴它要檢查什麼;check_nrpe 插件會連接到遠程的NRPE daemon,所用的方式是SSL;NRPE daemon 會運行相應的Nagios 插件來執行檢查;NRPE daemon 將檢查的結果返回給check_nrpe 插件,插件將其遞交給nagios做處理。注意:NRPE daemon 需要Nagios 插件安裝在遠程的Linux主機上,否則,daemon不能做任何的監控。
9.2 在被監控機(Nagios-Linux)上
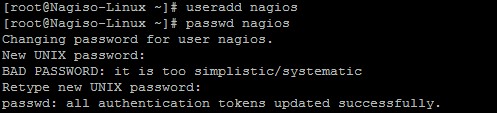
a. 增加用戶&設定密碼
# useradd nagios
# passwd nagios
b. 安裝Nagios 插件
# tar zxvf nagios-plugins-1.4.16.tar.gz
# cd nagios-plugins-1.4.16
# ./configure --prefix=/usr/local/nagios
# make && make install
這一步完成後會在/usr/local/nagios/下生成三個目錄include、libexec和share。

修改目錄權限
# chown nagios.nagios /usr/local/nagios
# chown -R nagios.nagios /usr/local/nagios/libexec

c. 安裝NRPE
# wget http://prdownloads.sourceforge.net/sourceforge/nagios/nrpe-2.13.tar.gz
# tar zxvf nrpe-2.13.tar.gz
# cd nrpe-2.13
# ./configure
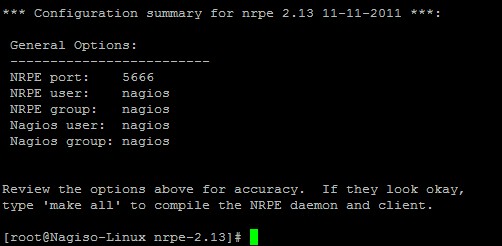
# make all
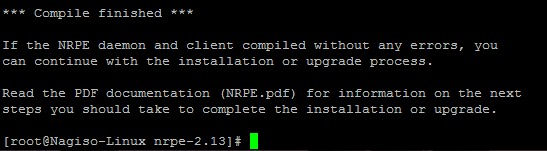
接下來安裝NPRE插件,daemon和示例配置文件。
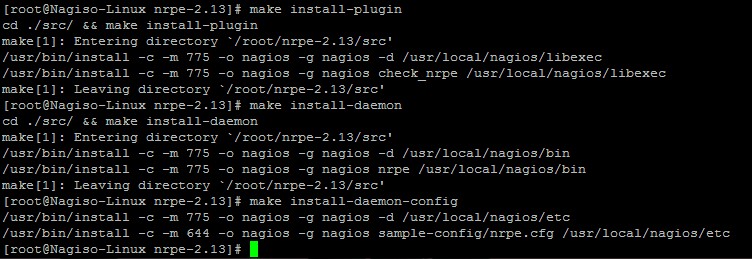
c.1 安裝check_nrpe 這個插件
# make install-plugin
監控機需要安裝check_nrpe 這個插件,被監控機並不需要,我們在這裡安裝它只是為了測試目的。
c.2 安裝deamon
# make install-daemon
c.3 安裝配置文件
# make install-daemon-config
現在再查看nagios 目錄就會發現有5個目錄了
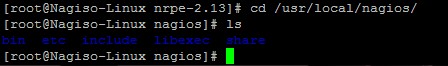
按照安裝文檔的說明,是將NRPE deamon作為xinetd下的一個服務運行的。在這樣的情況下xinetd就必須要先安裝好,不過一般系統已經默認安裝了。
d. 安裝xinted 腳本
# make install-xinetd

可以看到創建了這個文件/etc/xinetd.d/nrpe。
編輯這個腳本:
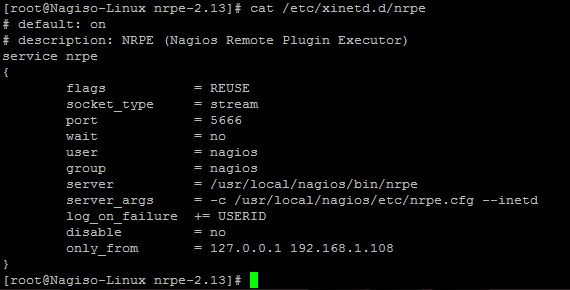
在only_from 後增加監控主機的IP地址。
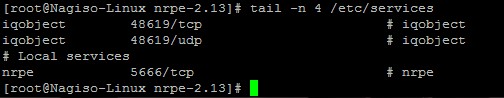
編輯/etc/services 文件,增加NRPE服務
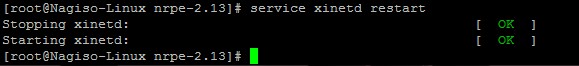
重啟xinted 服務
# service xinetd restart
查看NRPE 是否已經啟動

可以看到5666端口已經在監聽了。
e. 測試NRPE是否則正常工作
使用上面在被監控機上安裝的check_nrpe 這個插件測試NRPE 是否工作正常。
# /usr/local/nagios/libexec/check_nrpe -H localhost
會返回當前NRPE的版本

也就是在本地用check_nrpe連接nrpe daemon是正常的。
注:為了後面工作的順利進行,注意本地防火牆要打開5666能讓外部的監控機訪問。
f. check_nrpe 命令用法
查看check_nrpe 命令用法
# /usr/local/nagios/libexec/check_nrpe –h
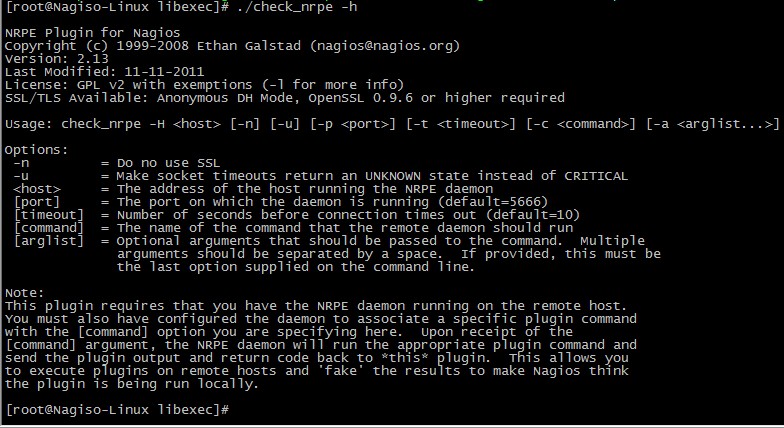
可以看到用法是:
check_nrpe –H 被監控的主機 -c 要執行的監控命令
注意:-c 後面接的監控命令必須是nrpe.cfg 文件中定義的。也就是NRPE daemon只運行nrpe.cfg中所定義的命令。
g. 查看NRPE的監控命令
# cd /usr/local/nagios/etc
# cat nrpe.cfg |grep -v "^#"|grep -v "^$"
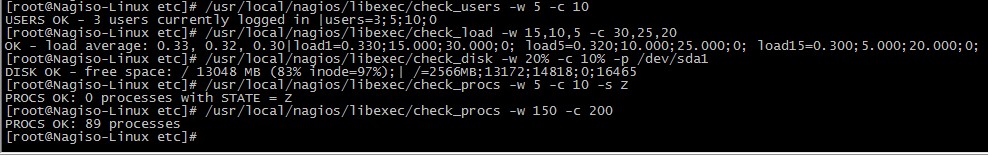
[root@Nagiso-Linux etc]# cat nrpe.cfg |grep -v "^#"|grep -v "^$"
log_facility=daemon
pid_file=/var/run/nrpe.pid
server_port=5666
nrpe_user=nagios
nrpe_group=nagios
allowed_hosts=127.0.0.1

dont_blame_nrpe=0
debug=0
command_timeout=60
connection_timeout=300
command[check_users]=/usr/local/nagios/libexec/check_users -w 5 -c 10
command[check_load]=/usr/local/nagios/libexec/check_load -w 15,10,5 -c 30,25,20
command[check_sda1]=/usr/local/nagios/libexec/check_disk -w 20% -c 10% -p /dev/sda1
command[check_zombie_procs]=/usr/local/nagios/libexec/check_procs -w 5 -c 10 -s Z
command[check_total_procs]=/usr/local/nagios/libexec/check_procs -w 150 -c 200
[root@Nagiso-Linux etc]#
紅色部分是命令名,也就是check_nrpe 的-c 參數可以接的內容,等號 “=” 後面是實際執行的插件程序(這與commands.cfg 中定義命令的形式十分相似,只不過是寫在了一行)。也就是說check_users 就是等號後面/usr/local/nagios/libexec/check_users -w 5 -c 10 的簡稱。
我們可以很容易知道上面這5行定義的命令分別是檢測登陸用戶數,cpu負載,sda1的容量,僵屍進程,總進程數。各條命令具體的含義見插件用法(執行“插件程序名 –h”)。
由於-c 後面只能接nrpe.cfg 中定義的命令,也就是說現在我們只能用上面定義的這五條命令。我們可以在本機實驗一下。
9.3 在監控主機(Nagios-Server)上
之前已經將Nagios運行起來了,現在要做的事情是:
安裝check_nrpe 插件;在commands.cfg 中創建check_nrpe 的命令定義,因為只有在commands.cfg 中定義過的命令才能在services.cfg 中使用;創建對被監控主機的監控項目;9.3.1 安裝check_nrpe 插件
# tar zxvf nrpe-2.13.tar.gz
# cd nrpe-2.13
# ./configure
# make all
# make install-plugin
只運行這一步就行了,因為只需要check_nrpe插件。
在Nagios-Linux 上我們已經裝好了nrpe,現在我們測試一下監控機使用check_nrpe 與被監控機運行的nrpe daemon之間的通信。

看到已經正確返回了NRPE的版本信息,說明一切正常。
9.3.2 在commands.cfg中增加對check_nrpe的定義
# vi /usr/local/nagios/etc/objects/commands.cfg
在最後面增加如下內容:
意義如下:
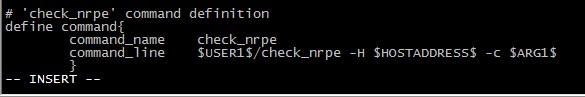
# 'check_nrpe' command definition
define command{
        command_name    check_nrpe         # 定義命令名稱為check_nrpe,在services.cfg中要使用這個名稱.
        command_line    $USER1$/check_nrpe -H $HOSTADDRESS$ -c $ARG1$       #這是定義實際運行的插件程序.
                        # 這個命令行的書寫要完全按照check_nrpe這個命令的用法,不知道用法的就用check_nrpe –h查看.
        }
-c 後面帶的$ARG1$ 參數是傳給nrpe daemon 執行的檢測命令,之前說過了它必須是nrpe.cfg 中所定義的那5條命令中的其中一條。在services.cfg 中使用check_nrpe 的時候要用 “!” 帶上這個參數。
9.3.3 定義對Nagios-Linux 主機的監控
下面就可以在services.cfg 中定義對Nagios-Linux 主機的監控了。
define service{
        use                     local-service
        host_name               Nagios-Linux
        service_description     Current Load
        check_command           check_nrpe!check_load
        }

define service{
        use                     local-service
        host_name               Nagios-Linux
        service_description     Check Disk sda1
        check_command           check_nrpe!check_sda1
        }

define service{
        use                     local-service
        host_name               Nagios-Linux
        service_description     Total Processes
        check_command           check_nrpe!check_total_procs
        }

define service{
        use                     local-service
        host_name               Nagios-Linux
        service_description     Current Users
        check_command           check_nrpe!check_users
        }

define service{
        use                     local-service
        host_name               Nagios-Linux
        service_description     Check Zombie Procs
        check_command           check_nrpe!check_zombie_procs
        }
還有一個任務是要監控Nagios-Linux 的swap 使用情況。但是在nrpe.cfg 中默認沒有定義這個監控功能的命令。怎麼辦?手動在nrpe.cfg 中添加,也就是自定義NRPE命令。
現在我們要監控swap 分區,如果空閒空間小於20%則為警告狀態 -> warning;如果小於10%則為嚴重狀態 -> critical。我們可以查得需要使用check_swap插件,完整的命令行應該是下面這樣。
# /usr/local/nagios/libexec/check_swap -w 20% -c 10%
在被監控機(Nagios-Linux)上增加check_swap 命令的定義
# vi /usr/local/nagios/etc/nrpe.cfg
增加下面這一行
command[check_swap]=/usr/local/nagios/libexec/check_swap -w 20% -c 10%
我們知道check_swap 現在就可以作為check_nrpe 的-c 的參數使用了
修改了配置文件,當然要重啟。
如果你是以獨立的daemon運行的nrpe,那麼需要手動重啟;如果你是在xinetd 下面運行的,則不需要。
由於本實驗中nrpe 是xinetd 下運行的,所以不需要重啟服務。
在監控機(Nagios-Server)上增加這個check_swap 監控項目
define service{
        use                     local-service
        host_name               Nagios-Linux
        service_description     Check Swap
        check_command           check_nrpe!check_swap
        }
同理,Nagios-Linux 上我還開啟了http 服務,需要監控一下,按照上面的做法,在被監控機(Nagios-Linux)上增加check_http 命令的定義
# vi /usr/local/nagios/etc/nrpe.cfg
增加下面這一行
command[check_http]=/usr/local/nagios/libexec/check_http -I 127.0.0.1
在監控機(Nagios-Server)上增加check_http 監控項目
define service{
        use                     local-service
        host_name               Nagios-Linux
        service_description     HTTP
        check_command           check_nrpe!check_http
        }
所有的配置文件已經修改好了,現在重啟Nagios。
# service nagios restart
9.3.4 查看配置情況
登錄Nagios Web監控頁http://192.168.1.108/nagios/ 查看相關信息。
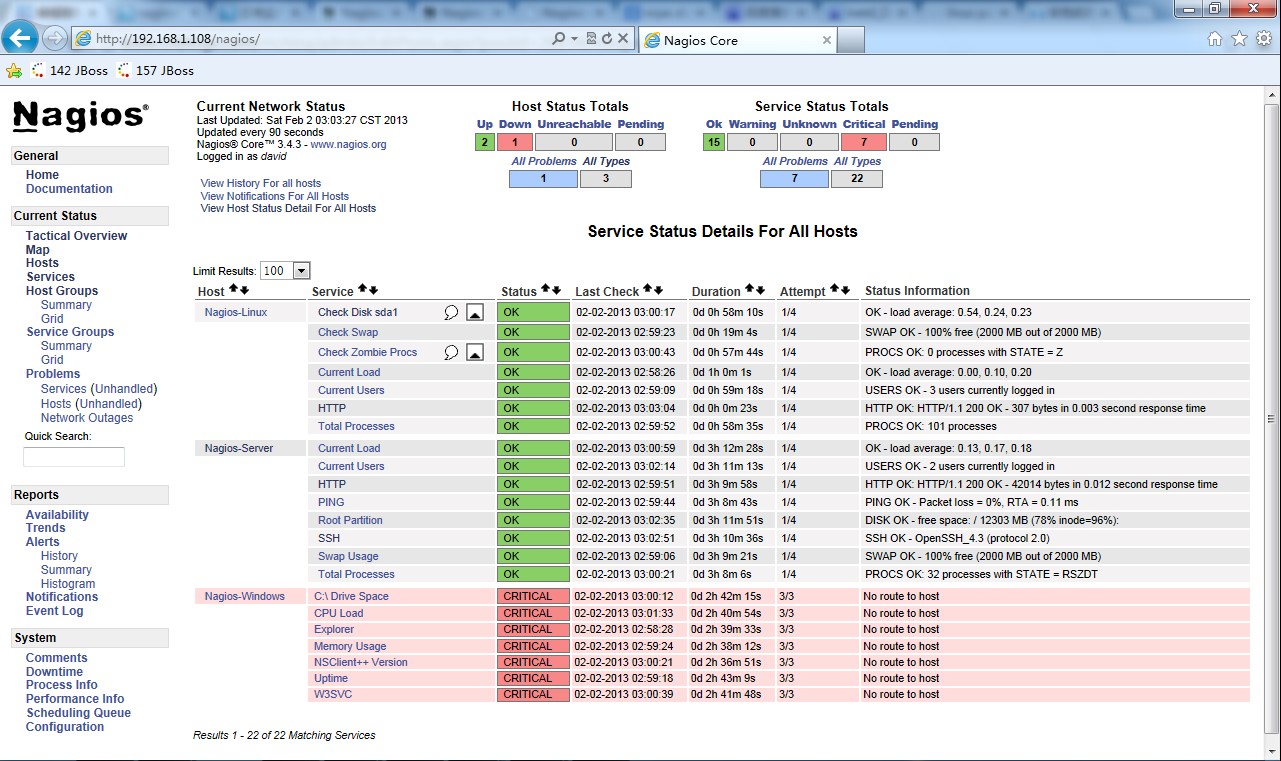
可以看到,對於Nagios-Server 和Nagios-Linux 上的相關服務的監控已經成功了,還有Nagios-Windows 上的服務還沒有定義,下面講到。
十、利用NSClient++監控遠程Windows上的“本地信息”
在Nagios的libexec下有check_nt這個插件,它就是用來檢查windows機器的服務的。其功能類似於check_nrpe。不過還需要搭配另外一個軟件NSClient++,它則類似於NRPE。
NSClient++的原理如下圖
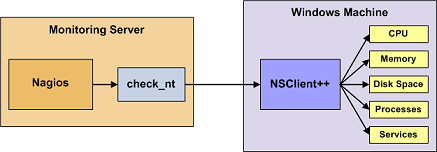
可以看到NSClient與nrpe最大的區別就是:
被監控機上安裝有nrpe,並且還有插件,最終的監控是由這些插件來進行的。當監控主機將監控請求發給nrpe後,nrpe調用插件來完成監控。NSClient++則不同,被監控機上只安裝NSClient,沒有任何的插件。當監控主機將監控請求發給NSClient++後,NSClient直接完成監控,所有的監控是由NSClient完成的。這也說明了NSClient++的一個很大的問題:不靈活、沒有可擴展性。它只能完成自己本身包含的監控操作,不能由一些插件來擴展。好在NSClient++已經做的不錯了,基本上可以完全滿足我們的監控需求。
10.1 安裝NSClient++
從http://www.nsclient.org/nscp/downloads 下載NSClient++-0.2.7.zip
解壓到C盤根目錄。
打開cmd 切換到c:\NSClient++-0.2.7
執行nsclient++ /install 進行安裝
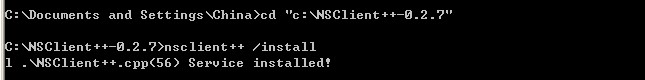
執行nsclient++ SysTray (注意大小寫),這一步是安裝系統托盤,時間稍微有點長。

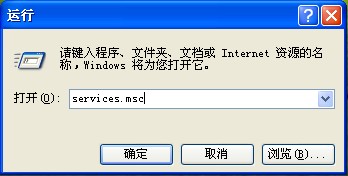
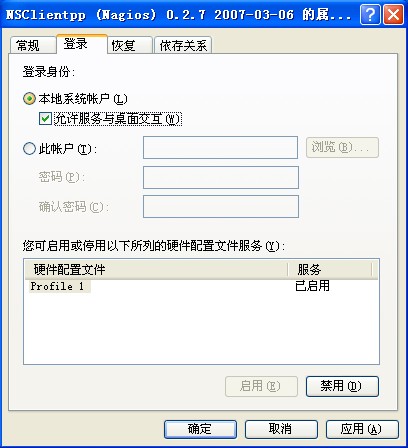
看到下圖就說明NSClient服務已經安裝上了

雙擊打開,點“登錄”標簽,在“允許服務與桌面交互”前打勾。
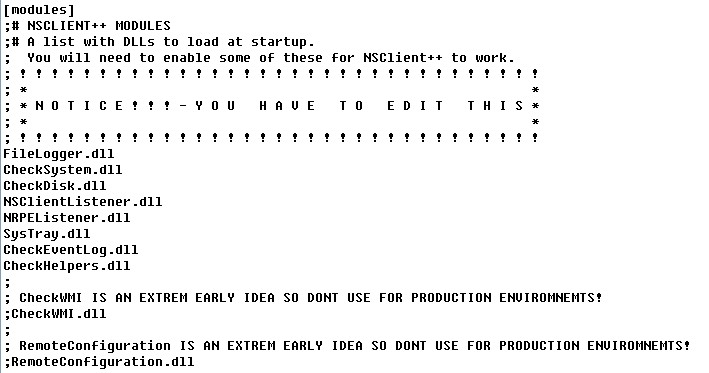
編輯c:\NSClient++-0.2.7下的NSC.ini文件。
將 [modules]部分的所有模塊前面的注釋都去掉,除了CheckWMI.dll 和 RemoteConfiguration.dll 這兩個。
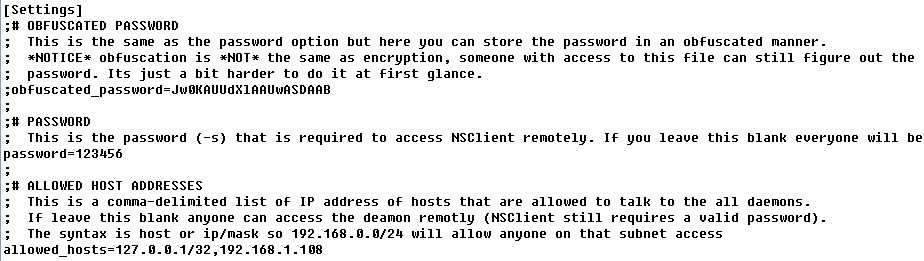
在[Settings]部分設置'password'選項來設置密碼,作用是在nagios連接過來時要求提供密碼。這一步是可選的,我這裡設置為'123456'。
將[Settings]部分'allowed_hosts'選項的注釋去掉,並且加上運行nagios的監控主機的IP。各IP之間以逗號相隔。這個地方是支持子網的,如果寫成192.168.1.0/24則表示該子網內的所有機器都可以訪問。如果這個地方是空白則表示所有的主機都可以連接上來。
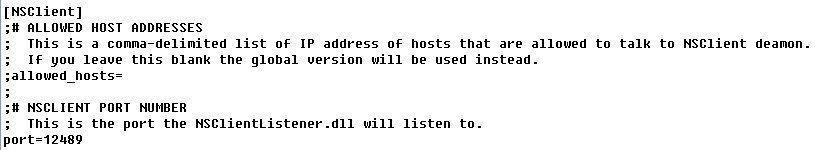
注意是[Settings]部分的,因為[NSClient]部分也有這個選項。
必須保證[NSClient]的'port'選項並沒有被注釋,並且它的值是'12489',這是NSClient的默認監聽端口。
在cmd 中執行nsclient++ /start啟動服務,注意所在目錄是c:\NSClient++-0.2.7
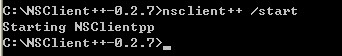
這時在桌面右下角的系統托盤處會出現一個黃色的M字樣的圖標

查看服務

已經正常啟動了。
注意服務默認設的是“自動”,也就是說是開機自動啟動的。
在cmd 裡面執行netstat –an 可以看到已經開始監聽tcp的12489端口了。

這樣外部就可以訪問了嗎?
錯!
防火牆也要打開tcp的12489端口,否則nagios 檢查此服務的時候會報錯。
這樣被監控機的配置就搞定了,它就等待nagios 發出某個監控請求,然後它執行請求將監控的結果發回到nagios監控主機上。
之前已經在監控主機(Nagios-Server)上對Windows 主機的監控做了配置,但是commands.cfg 中默認沒有設置密碼項,所以要修改一下,增加"-s 123456",如下:
# 'check_nt' command definition
define command{
        command_name    check_nt
        command_line    $USER1$/check_nt -H $HOSTADDRESS$ -p 12489 -s 123456 -v $ARG1$ $ARG2$
        }
現在打開Nagios Web監控頁便可查看到相關信息了。
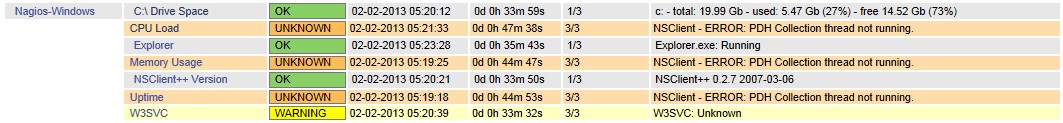
可以看到有錯誤:NSClient - ERROR: PDH Collection thread not running.
Google 一下,是由於操作系統語言的問題,好像NSClient 默認支持的語言並不多,具體可以百度一下。
查看NSClient的日志C:\NSClient++-0.2.7\nsclient.log,信息如下:
2013-02-02 22:05:30: error:.\PDHCollector.cpp:98: You need to manually configure performance counters!
需要手動配置performance counters。
打開C:\NSClient++-0.2.7\counters.defs文件,復制文件裡面"English US"那部分內容,粘貼到counters.defs 文件的最後,修改Description = "Chinese"。
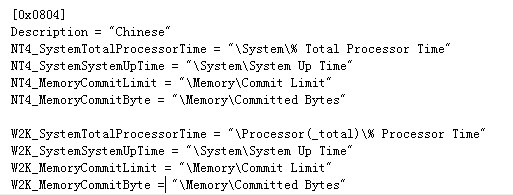
修改完之後,在mmc中重啟NSClient 服務。
然後查看日志,內容如下:

在正常執行了。
打開Nagios Web監控頁查看。
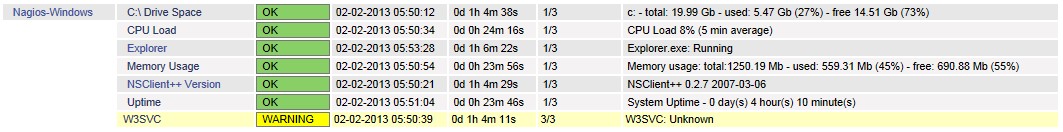
執行成功,但是W3SVC服務為Unknown 狀態。查資料,需要開啟Windows 的IIS服務。
打開“控制面板”進行安裝。
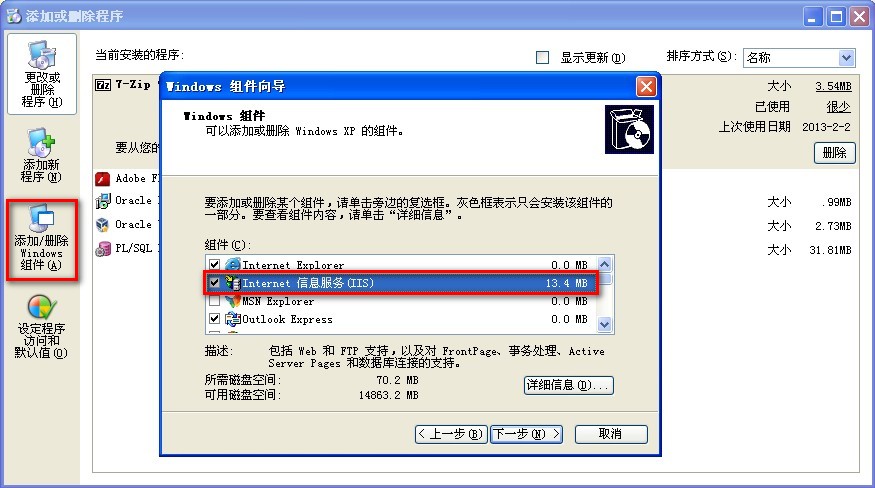
安裝完畢後,再到Nagios Web監控頁查看,全部監控正常。
十一、Nagios郵件報警的配置
11.1 安裝sendmail 組件
首先要確保sendmail 相關組件的完整安裝,我們可以使用如下的命令來完成sendmail 的安裝:
# yum install -y sendmail*
然後重新啟動sendmail服務:
# service sendmail restart
然後發送測試郵件,驗證sendmail的可用性:
# echo "Hello World" | mail david.tang@bsmart.cn
11.2 郵件報警的配置
在上面我們已經簡單配置過了/usr/local/nagios/etc/objects/contacts.cfg 文件,Nagios 會將報警郵件發送到配置文件裡的E-mail 地址。
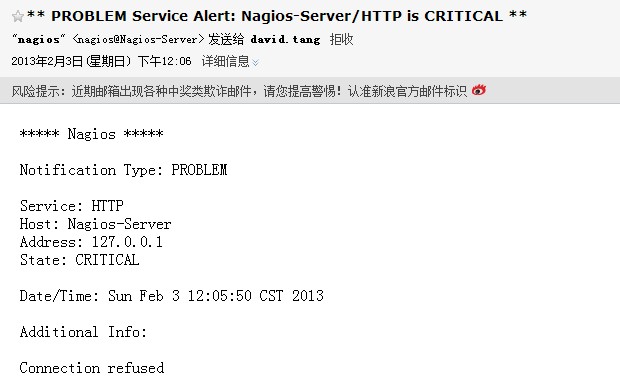
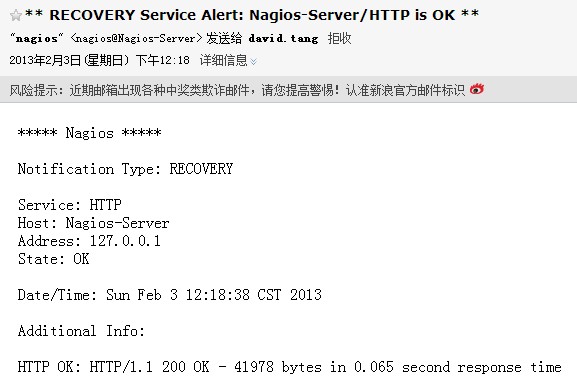
11.3 Nagios 通知
PROBLEM
RECOVERY
Linux下Nagios安裝配置完畢。