Plugin for Nagios which allows monitoring the internals of WebSphere Application Server.
Start here: InitialConfiguration
Currently, the following items are currently possible to monitor:
下載地址:http://code.google.com/p/nagios-was/downloads/detail?name=check_was-0.4-bin.tar.gz&can=2&q=
安裝:
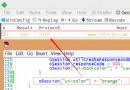
修改check_was程序:
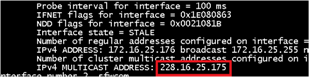
JAVA_HOME指定錯誤的話會報錯:
修改check_was.servers
測試
修改websphere主機的nrpe.cfg
修改Nagios 對應websphere的cfg文件:
重啟nagios跟nrpe客戶端
check_was可以監控的內容:
MonitorLiveSessions:
check_was -s sessions -w 200 -c 400 -p <server name> -n <host name>
可以查看某一個JVM的全部sessions也可以指定某一個應用的session 加上-n 應用名
MonitorJvmHeapsize:
check_was -s heapsize -w 80 -c 90 -p <server name>
MonitorJdbcConnectionPools 數據庫連接池:
check_was -s connectionpool -w 80 -c 90 -p <server name> -n <connection pool name>
MonitorThreadPools : 線程:
check_was -s threadpool -w 80 -c 90 -p <server name> -n <thread pool name>
線程池數據
WebContainer
ORB.thread.pool
MessageListenerThreadPool
SoapConnectorThreadPool
WebContainer
HAManager.thread.pool
DRSThreadPool