


top命令經常用來監控linux的系統狀況,比如cpu、內存的使用,程序員基本都知道這個命令,今天學習啦小編與大家分享下Top 命令解析,有興趣的朋友不妨了解下。
Top 命令解析
TOP是一個動態顯示過程,即可以通過用戶按鍵來不斷刷新當前狀態.如果在前台執行該命令,它將獨占前台,直到用戶終止該程序為止.比較准確的說,top命令提供了實時的對系統處理器的狀態監視.它將顯示系統中CPU最“敏感”的任務列表.該命令可以按CPU使用.內存使用和執行時間對任務進行排序;而且該命令的很多特性都可以通過交互式命令或者在個人定制文件中進行設定.
top - 12:38:33 up 50 days, 23:15, 7 users, load average: 60.58, 61.14, 61.22
Tasks: 203 total, 60 running, 139 sleeping, 4 stopped, 0 zombie
Cpu(s) : 27.0%us, 73.0%sy, 0.0%ni, 0.0%id, 0.0%wa, 0.0%hi, 0.0%si, 0.0%st
Mem: 1939780k total, 1375280k used, 564500k free, 109680k buffers
Swap: 4401800k total, 497456k used, 3904344k free, 848712k cached
PID USER PR NI VIRT RES SHR S %CPU %MEM TIME+ COMMAND
4338 oracle 25 0 627m 209m 207m R 0 11.0 297:14.76 oracle
4267 oracle 25 0 626m 144m 143m R 6 7.6 89:16.62 oracle
3458 oracle 25 0 672m 133m 124m R 0 7.1 1283:08 oracle
3478 oracle 25 0 672m 124m 115m R 0 6.6 1272:30 oracle
3395 oracle 25 0 672m 122m 113m R 0 6.5 1270:03 oracle
3480 oracle 25 0 672m 122m 109m R 8 6.4 1274:13 oracle
3399 oracle 25 0 672m 121m 110m R 0 6.4 1279:37 oracle
4261 oracle 25 0 634m 100m 99m R 0 5.3 86:13.90 oracle
25737 oracle 25 0 632m 81m 74m R 0 4.3 272:35.42 oracle
7072 oracle 25 0 626m 72m 71m R 0 3.8 6:35.68 oracle
16073 oracle 25 0 630m 68m 63m R 8 3.6 175:20.36 oracle
16140 oracle 25 0 630m 66m 60m R 0 3.5 175:13.42 oracle
16122 oracle 25 0 630m 66m 60m R 0 3.5 176:47.73 oracle
786 oracle 25 0 627m 63m 63m R 0 3.4 1:54.93 oracle
4271 oracle 25 0 627m 59m 58m R 8 3.1 86:09.64 oracle
4273 oracle 25 0 627m 57m 56m R 8 3.0 84:38.20 oracle
22670 oracle 25 0 626m 50m 49m R 0 2.7 84:55.82 oracle
一. TOP前五行統計信息
統計信息區前五行是系統整體的統計信息。
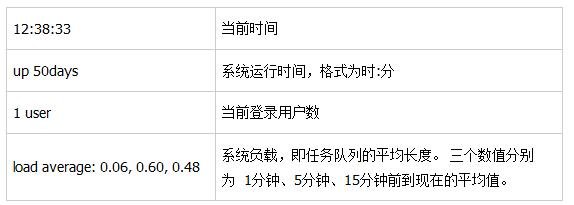
1. 第一行是任務隊列信息
同 uptime 命令的執行結果:
[root@localhost ~]# uptime
13:22:30 up 8 min, 4 users, load average: 0.14, 0.38, 0.25
其內容如下:
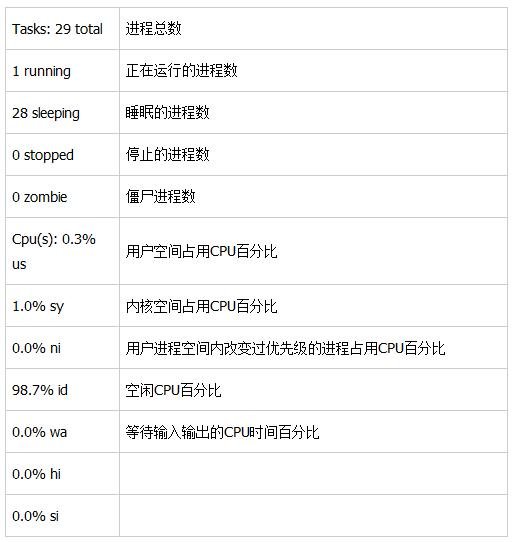
2. 第二、三行為進程和CPU的信息
當有多個CPU時,這些內容可能會超過兩行。內容如下:
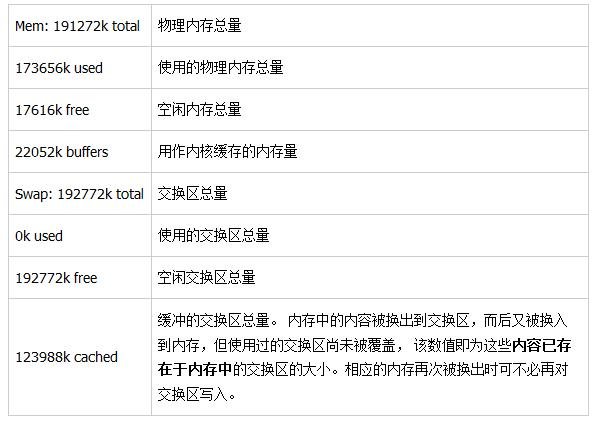
3. 第四五行為內存信息。
內容如下:
二. 進程信息
top 的man 命令解釋如下:
Listed below are top's available fields. They are always associated with the letter shown, regardless of the position you may have established for them with the 'o' (Order fields) interactive command.Any field is selectable as the sort field, and you control whether they are sorted high-to-low or low-to-high. For additional information on sort provisions see topic 3c. TASK Area Commands.
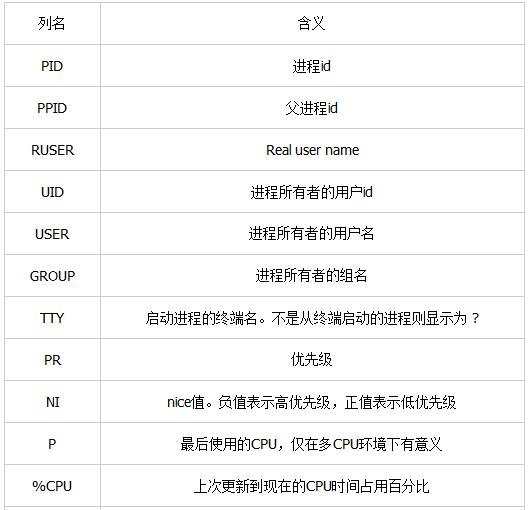
a: PID -- Process Id
The task's unique process ID, which periodically wraps, though never restarting at zero.
b: PPID -- Parent Process Pid
The process ID of a task's parent.
c: RUSER -- Real User Name
The real user name of the task's owner.
d: UID -- User Id
The effective user ID of the task's owner.
e: USER -- User Name
The effective user name of the task's owner.
f: GROUP -- Group Name
The effective group name of the task's owner.
g: TTY -- Controlling Tty
The name of the controlling terminal. This is usually the device (serial port, pty, etc.) from which the process was started, and which it uses for input oroutput. However, a task need not be associated with a terminal, in which case you'll see '?' displayed.
h: PR -- Priority
The priority of the task.
i: NI -- Nice value
The nice value of the task. A negative nice value means higher priority, whereas a positive nice value means lower priority. Zero in this field simply means priority will not be adjusted in determining a task's dispatchability.
j: P -- Last used CPU (SMP)
A number representing the last used processor. In a true SMP environment this will likely change frequently since the kernel intentionally uses weak affinity. Also, the very act of running top may break this weak affinity and cause more processes to change CPUs more often (because of the extra demand for cpu time).
k: %CPU -- CPU usage
The task's share of the elapsed CPU time since the last screen update, expressed as a percentage of total CPU time. In a true SMP environment, if 'Irix mode' is Off, top will operate in 'Solaris mode' where a task's cpu usage will be divided by the total number of CPUs. You toggle 'Irix/Solaris' modes with the 'I' interactive command.
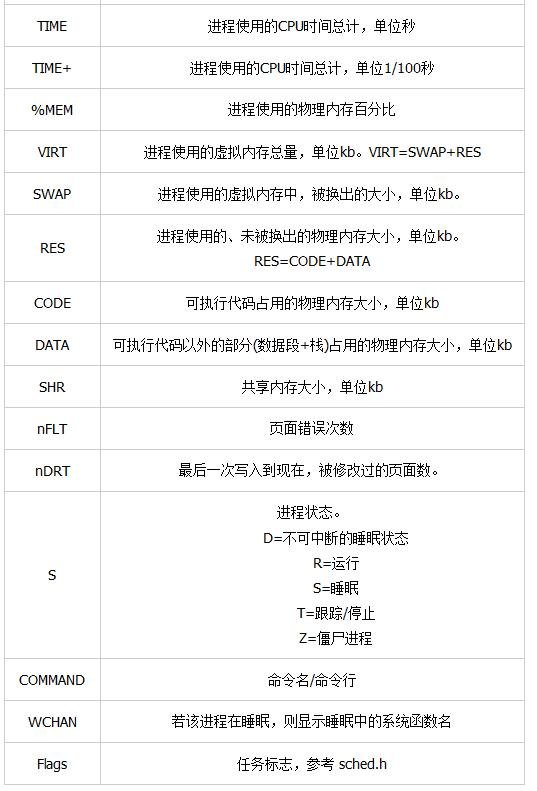
l: TIME -- CPU Time
Total CPU time the task has used since it started. When 'Cumulative mode' is On, each process is listed with the cpu time that it and its dead children has used. You toggle 'Cumulative mode' with 'S', which is a command-line option and an interactive command. See the 'S' interactive command for additional information regarding this mode.
m: TIME+ -- CPU Time, hundredths
The same as 'TIME', but reflecting more granularity through hundredths of a sec ond.
n: %MEM -- Memory usage (RES)
A task's currently used share of available physical memory.
o: VIRT -- Virtual Image (kb)
The total amount of virtual memory used by the task. It includes all code, data and shared libraries plus pages that have been swapped out. (Note: you can define the STATSIZE=1 environment variable and the VIRT will be calculated from the /proc/#/state VmSize field.)
VIRT = SWAP + RES.
p: SWAP -- Swapped size (kb)
The swapped out portion of a task's total virtual memory image.
q: RES -- Resident size (kb)
The non-swapped physical memory a task has used.
RES = CODE + DATA.
r: CODE -- Code size (kb)
The amount of physical memory devoted to executable code, also known as the'text resident set' size or TRS.
s: DATA -- Data+Stack size (kb)
The amount of physical memory devoted to other than executable code, also known the 'data resident set' size or DRS.
t: SHR -- Shared Mem size (kb)
The amount of shared memory used by a task. It simply reflects memory that could be potentially shared with other processes.
u: nFLT -- Page Fault count
The number of major page faults that have occurred for a task. A page fault occurs when a process attempts to read from or write to a virtual page that is not currently present in its address space. A major page fault is when disk access is involved in making that page available.
v: nDRT -- Dirty Pages count
The number of pages that have been modified since they were last written to disk. Dirty pages must be written to disk before the corresponding physical memory location can be used for some other virtual page.
w: S -- Process Status
The status of the task which can be one of:
'D' = uninterruptible sleep
'R' = running
'S' = sleeping
'T' = traced or stopped
'Z' = zombie
Tasks shown as running should be more properly thought of as 'ready to run' --their task_struct is simply represented on the Linux run-queue. Even without a true SMP machine, you may see numerous tasks in this state depending on top's delay interval and nice value.
x: Command -- Command line or Program name
Display the command line used to start a task or the name of the associated program. You toggle between command line and name with 'c', which is both a command-line option and an interactive command. When you've chosen to display command lines, processes without a command line (like kernel threads) will be shown with only the program name in parentheses, as in this example: ( mdrecoveryd ) Either form of display is subject to potential truncation if it's too long to fit in this field's current width. That width depends upon other fields selected, their order and the current screen width.
Note: The 'Command' field/column is unique, in that it is not fixed-width. When displayed, this column will be allocated all remaining screen width (up to the maximum 512 characters) to provide for the potential growth of program names into command lines.
y: WCHAN -- Sleeping in Function
Depending on the availability of the kernel link map ('System.map'), this field will show the name or the address of the kernel function in which the task is currently sleeping. Running tasks will display a dash ('-') in this column.
Note: By displaying this field, top's own working set will be increased by over 700Kb. Your only means of reducing that overhead will be to stop and restart top.
z: Flags -- Task Flags
This column represents the task's current scheduling flags which are expressed in hexadecimal notation and with zeros suppressed. These flags are officially documented in <linux/sched.h>. Less formal documentation can also be found on the 'Fields select' and 'Order fields' screens.
默認情況下僅顯示比較重要的 PID、USER、PR、NI、VIRT、RES、SHR、S、%CPU、%MEM、TIME+、COMMAND 列。
2.1 用快捷鍵更改顯示內容。
(1)更改顯示內容通過 f鍵可以選擇顯示的內容。
按 f 鍵之後會顯示列的列表,按 a-z 即可顯示或隱藏對應的列,最後按回車鍵確定。
(2)按o鍵可以改變列的顯示順序。
按小寫的 a-z 可以將相應的列向右移動,而大寫的 A-Z 可以將相應的列向左移動。最後按回車鍵確定。
按大寫的 F 或 O 鍵,然後按 a-z 可以將進程按照相應的列進行排序。而大寫的 R 鍵可以將當前的排序倒轉。
設置完按回車返回界面。
三. 命令使用
詳細內容可以參考MAN 幫助文檔。這裡列舉部分內容:
命令格式:
top [-] [d] [p] [q] [c] [C] [S] [n]
參數說明:
d: 指定每兩次屏幕信息刷新之間的時間間隔。當然用戶可以使用s交互命令來改變之。
p: 通過指定監控進程ID來僅僅監控某個進程的狀態。
q:該選項將使top沒有任何延遲的進行刷新。如果調用程序有超級用戶權限,那麼top將以盡可能高的優先級運行。
S: 指定累計模式
s : 使top命令在安全模式中運行。這將去除交互命令所帶來的潛在危險。
i: 使top不顯示任何閒置或者僵死進程。
c: 顯示整個命令行而不只是顯示命令名
在top命令的顯示窗口,我們還可以輸入以下字母,進行一些交互:
幫助文檔如下:
Help for Interactive Commands - procps version 3.2.7
Window 1:Def: Cumulative mode Off. System: Delay 4.0 secs; Secure mode Off.
Z,B Global: 'Z' change color mappings; 'B' disable/enable bold
l,t,m Toggle Summaries: 'l' load avg; 't' task/cpu stats; 'm' mem info
1,I Toggle SMP view: '1' single/separate states; 'I' Irix/Solaris mode
f,o . Fields/Columns: 'f' add or remove; 'o' change display order
F or O . Select sort field
<,> . Move sort field: '<' next col left; '>' next col right
R,H . Toggle: 'R' normal/reverse sort; 'H' show threads
c,i,S . Toggle: 'c' cmd name/line; 'i' idle tasks; 'S' cumulative time
x,y . Toggle highlights: 'x' sort field; 'y' running tasks
z,b . Toggle: 'z' color/mono; 'b' bold/reverse (only if 'x' or 'y')
u . Show specific user only
n or # . Set maximum tasks displayed
k,r Manipulate tasks: 'k' kill; 'r' renice
d or s Set update interval
W Write configuration file
q Quit
( commands shown with '.' require a visible task display window )
Press 'h' or '?' for help with Windows,
h或者? : 顯示幫助畫面,給出一些簡短的命令總結說明。
k :終止一個進程。系統將提示用戶輸入需要終止的進程PID,以及需要發送給該進程什麼樣的信號。一般的終止進程可以使用15信號;如果不能正常結束那就使用信號9強制結束該進程。默認值是信號15。在安全模式中此命令被屏蔽。
i:忽略閒置和僵死進程。這是一個開關式命令。
q: 退出程序。
r: 重新安排一個進程的優先級別。系統提示用戶輸入需要改變的進程PID以及需要設置的進程優先級值。輸入一個正值將使優先級降低,反之則可以使該進程擁有更高的優先權。默認值是10。
S:切換到累計模式。
s : 改變兩次刷新之間的延遲時間。系統將提示用戶輸入新的時間,單位為s。如果有小數,就換算成ms。輸入0值則系統將不斷刷新,默認值是5 s。需要注意的是如果設置太小的時間,很可能會引起不斷刷新,從而根本來不及看清顯示的情況,而且系統負載也會大大增加。
f或者F :從當前顯示中添加或者刪除項目。
o或者O :改變顯示項目的順序。
l: 切換顯示平均負載和啟動時間信息。即顯示影藏第一行
m: 切換顯示內存信息。即顯示影藏內存行
t : 切換顯示進程和CPU狀態信息。即顯示影藏CPU行
c: 切換顯示命令名稱和完整命令行。 顯示完整的命令。 這個功能很有用。
M : 根據駐留內存大小進行排序。
P:根據CPU使用百分比大小進行排序。
T: 根據時間/累計時間進行排序。
W: 將當前設置寫入~/.toprc文件中。這是寫top配置文件的推薦方法。
看過“Top 命令解析”的人還看了: