3.4 Disk bottlenecks 磁盤瓶頸
The disk subsystem is often the most important aspect of server performance and is usually the most common bottleneck.
However, problems can be hidden by other factors, such as lack of memory.
Applications are considered to be I/O-bound when CPU cycles are wasted simply waiting for I/O tasks to finish.
磁盤子系統是服務器性能最重要的方面,通常它也是最常見的瓶頸;
然而,它的問題通常隱藏在其它因素之下,如缺少內存;
當CPU周期都浪費在等待I/O任務完成時,這樣的應用程序被認為是I/O密集型;
The most common disk bottleneck is having too few disks.
Most disk configurations are based on capacity requirements, not performance.
The least expensive solution is to purchase the smallest number of the largest capacity disks possible.
However, this places more user data on each disk,
causing greater I/O rates to the physical disk and allowing disk bottlenecks to occur.
最常見的磁盤瓶頸是硬盤太小;
大多數的磁盤配置是基於容量需求,而不是性能;
最便宜的解決方案可能是少量的大容量磁盤;
The second most common problem is having too many logical disks on the same array.
This increases seek time and significantly lowers performance.
The disk subsystem is discussed in 4.6, “Tuning the disk subsystem” on page 112.
第二個常見的問題是在同一個陳列中有過多的邏輯磁盤,
這會增加尋道時間而顯著降低性能;
3.4.1 Finding disk bottlenecks
尋找磁盤瓶頸
A server exhibiting the following symptoms might be suffering from a disk bottleneck (or a hidden memory problem):
如果服務器出現了下列現象就有可能是遇到了磁盤瓶頸(或隱含的內存問題):
. Slow disks will result in 緩慢的磁盤會導致:
– Memory buffers filling with write data (or waiting for read data), which will delay all
requests because free memory buffers are unavailable for write requests (or the
response is waiting for read data in the disk queue).
內存buffer將會被寫數據填充(或等待讀數據),這會導致所有的響應變慢,
因為對於寫請求來說,沒有可用的空間內存buffer(或這個響應在等待從磁盤隊列中讀數據)。
– Insufficient memory, as in the case of not enough memory buffers for network requests,
will cause synchronous disk I/O.
內存不足,在沒有足夠的內存緩沖用於網絡請求的情況下,將導致磁盤I/O 同步;
. Disk utilization, controller utilization, or both will typically be very high.
磁盤利用率,控制器利用率,或者這兩者都很有可能;
. Most LAN transfers will happen only after disk I/O has completed, causing very long
response times and low network utilization.
大多數的的LAN傳輸都會在磁盤I/O完成後會發生,會造成非常長的響應時間和很低的網絡選用率;
. Disk I/O can take a relatively long time and disk queues will become full, so the CPUs will
be idle or have low utilization because they wait long periods of time before processing the
next request.
磁盤I/O會消耗很長的時間並導致磁盤隊列變滿,因此CPU將會變得很閒或很低的利用率,
因為它們在處理下個響應之前,要等待很長的時間;
The disk subsystem is perhaps the most challenging subsystem to properly configure.
Besides looking at raw disk interface speed and disk capacity, it is also important to understand the workload.
Is disk access random or sequential? Is there large I/O or small I/O?
Answering these questions provides the necessary information to make sure the disk subsystem is adequately tuned.
磁盤子系統可能是實現合適配置的最有挑戰的子系統;
除了要關注原始磁盤接口速度和硬盤容量外,工作負載也同樣重要;
磁盤訪問是隨機的還是序列的?是重I/O,還是輕I/O的?
只有回答了這些問題後才能提供必要的信息來調整磁盤子系統;
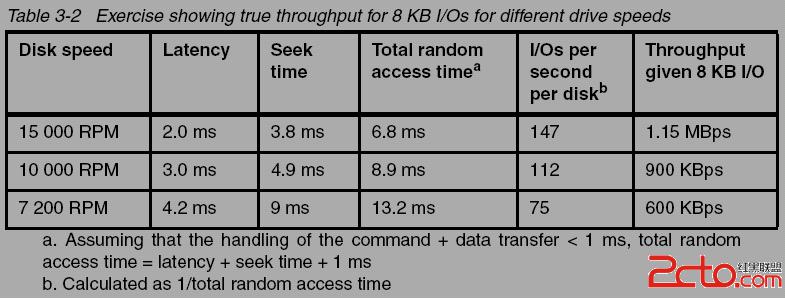
Disk manufacturers tend to showcase the upper limits of their drive technology’s throughput.
However, taking the time to understand the throughput of your workload will help you
understand what true expectations to have of your underlying disk subsystem.
磁盤制造商傾向於炫耀他們驅動技術的吞吐量的上限,
然而,理解你工作負載的吞吐量將有助於理解你對磁盤子系統的真正期望;
Random read/write workloads usually require several disks to scale.
The bus bandwidths of SCSI or Fibre Channel are of lesser concern.
Larger databases with random access workload will benefit from having more disks.
Larger SMP servers will scale better with more disks.
Given the I/O profile of 70% reads and 30% writes of the average commercial workload,
a RAID-10 implementation will perform 50% to 60% better than a RAID-5.
隨機讀/寫工作負載通常請求多個磁盤擴展;
SCSI的bus的帶寬或Fibre通常不怎麼關注;
隨機訪問方式的大數據庫在多個磁盤情況下很有好處;
大型SMP服務器在擴展上要好於多磁盤;
假如平均工作負載 是70%的讀和30%的寫,則RAID-10要比RAID-5效率高50%~60%;
Sequential workloads tend to stress the bus bandwidth of disk subsystems.
Pay special attention to the number of SCSI buses and Fibre Channel controllers when maximum throughput is desired.
Given the same number of drives in an array, RAID-10, RAID-0,
and RAID-5 all have similar streaming read and write throughput.
序列工作負載對bus帶寬和磁盤子系統有很大的壓力;
假如在陳列中有相同數量的磁盤,RAID-10, RAID-0, RAID-5有相同的流讀寫吞吐量;
There are two ways to approach disk bottleneck analysis:
real-time monitoring and tracing.
有兩種方法來對磁盤瓶頸進行分析:
實時監測和跟蹤;
. Real-time monitoring must be done while the problem is occurring. This might not be
practical in cases where system workload is dynamic and the problem is not repeatable.
However, if the problem is repeatable, this method is flexible because of the ability to add
objects and counters as the problem becomes clear.
實時監測必須在問題出現時做,這在系統負載是動態的且問題不能重現時很難操作,
然而,如果問題可以重現,這個方法就很有用了;
. Tracing is the collecting of performance data over time to diagnose a problem. This is a
good way to perform remote performance analysis. Some of the drawbacks include the
potential for having to analyze large files when performance problems are not repeatable,
and the potential for not having all key objects and parameters in the trace and having to
wait for the next time the problem occurs for the additional data.
跟蹤是通過長時間收集性能數據來診斷問題,對於遠程性能分析來說,這是一個很好的方法;
但這個方法也有一些缺點,分析大文件時,性能問題不可重復;
未對重要對象和參數進行跟蹤等;
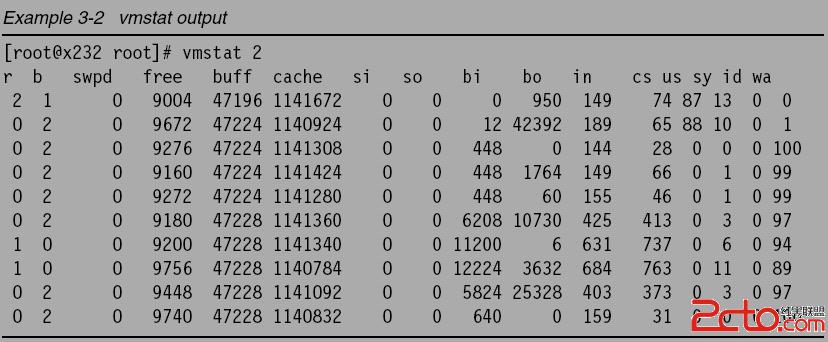
vmstat command
One way to track disk usage on a Linux system is by using the vmstat tool. The important
columns in vmstat with respect to I/O are the bi and bo fields. These fields monitor the
movement of blocks in and out of the disk subsystem. Having a baseline is key to being able
to identify any changes over time.
Linux系統的硬盤跟蹤工具可以使用vmstat,
它是最重要的列是bi和bo, 它們監測了有磁盤子系統的塊的輸入和輸出的移動,
有一個基准線來標識改變很重要;
iostat command
Performance problems can be encountered when too many files are opened, read and written
to, then closed repeatedly. This could become apparent as seek times (the time it takes to
move to the exact track where the data is stored) start to increase. Using the iostat tool, you
can monitor the I/O device loading in real time. Different options enable you to drill down even
deeper to gather the necessary data.
iostats可以用於監測實時的I/O設備負載,不同的選項可做進一步的分析;
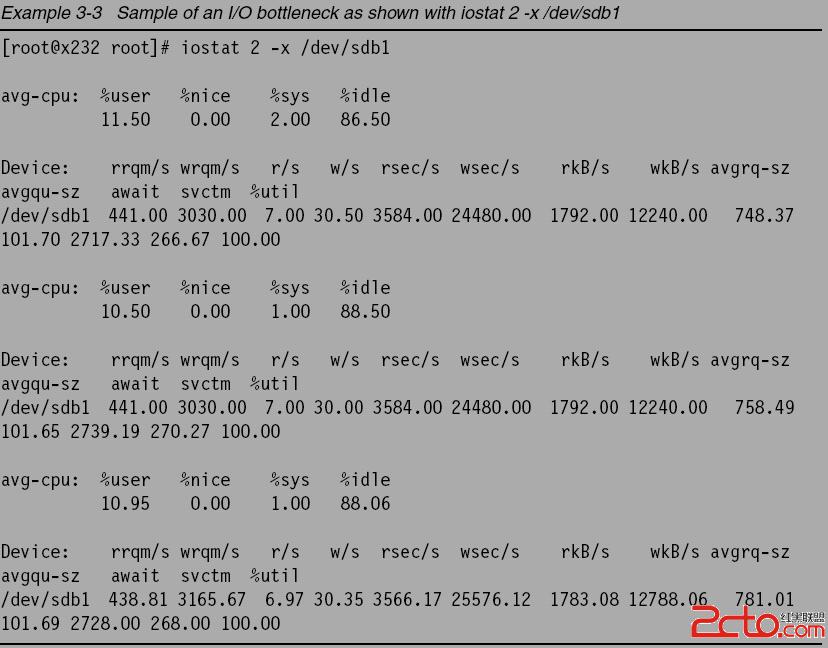
Example 3-3 shows a potential I/O bottleneck on the device /dev/sdb1. This output shows
average wait times (await) of about 2.7 seconds and service times (svctm) of 270 ms.
For a more detailed explanation of the fields, see the man page for iostat(1).
Changes made to the elevator algorithm as described in 4.6.2, “I/O elevator tuning and
selection” on page 115 will be seen in avgrq-sz (average size of request) and avgqu-sz
(average queue length). As the latencies are lowered by manipulating the elevator settings,
avgrq-sz will decrease. You can also monitor the rrqm/s and wrqm/s to see the effect on the
number of merged reads and writes that the disk can manage.
更多的細節可見iostat的man頁面;
3.4.2 Performance tuning options
性能調整選項
After verifying that the disk subsystem is a system bottleneck, several solutions are possible.
當確認磁盤子系統是系統瓶頸時,有多個解決辦法可用;
These solutions include the following:
. If the workload is of a sequential nature and it is stressing the controller bandwidth, the
solution is to add a faster disk controller. However, if the workload is more random in
nature, then the bottleneck is likely to involve the disk drives, and adding more drives will
improve performance.
如果工作負載是序列式的且控制器的帶寬壓力很大時,解決辦法是添加更快速的磁盤控制器;
如果工作負載是隨機式的時,瓶頸可能是硬盤驅動,增加驅動可以改善性能;
. Add more disk drives in a RAID environment. This spreads the data across multiple
physical disks and improves performance for both reads and writes. This will increase the
number of I/Os per second. Also, use hardware RAID instead of the software
implementation provided by Linux. If hardware RAID is being used, the RAID level is
hidden from the OS.
在RAID環境中添加更多的磁盤驅動,這能使數據跨越多個物理磁盤並改善讀寫性能;
同樣,使用硬件RAID替代軟件RAID也有效果;
. Consider using Linux logical volumes with striping instead of large single disks or logical
volumes without striping.
考慮使用Linux條帶方式的邏輯卷;
. Offload processing to another system in the network (users, applications, or services).
卸載進程到網絡的另一個系統;
. Add more RAM. Adding memory increases system memory disk cache, which in effect
improves disk response times.
增加更多的RAM,添加內存增加了系統的內存磁盤cache, 可以改善磁盤的響應時間;


