現在在網上可以找的科學作圖軟件有不少,其中不乏優秀者,Win平台上有大名鼎鼎的Origin、Tecplot、SigmaPlot等,類UNIX上有LabPlot、gnuplot等。其他的常見的計算軟件如Matlab、Mathematica、Maple、Scilab、IDL、Maxima等也都對科學作圖有很好的支持,甚至於只要稍加努力使用MS的Excel也可以做出不錯的圖來。但是筆者最喜愛的工具還是gnuplot。gnuplot 是典型的UNIX 哲學的產物,小巧,靈活,擅長於與其他工具協同工作。本人使用gnuplot 已經有1年有余,積累了些經驗,下面的內容主要是我1年多來使用gnuplot所做筆記的一個總結,當然,在成稿過程中也將gnuplot 的手冊又來回翻了幾遍。
gnuplot是一個命令行驅動的科學繪圖工具,可將數學函數或數值資料以平面圖或立體圖的形式畫在不同種類終端機或繪圖輸出裝置上。它是由Colin Kelley 和 Thomas Williams於1986年開發的繪圖程序發展而來的,可以在多個平台下使用。gnuplot既支持命令行交互模式,也支持腳本。
gnuplot 的主要作者有:Thomas Williams, Colin Kelley, Russell Lang, Dave Kotz, John Campbell, Gershon Elber, Alexander Woo 和許多其他人。
gnuplot 與自由軟件基金會和GNU 項目沒有任何直接的關系,因此將 gnuplot 稱為 GNUplot 是不對的。gnuplot 是完全獨立的設計和開發的,命名為 gnuplot 只是種妥協,當時Thomas 希望他們開發的程序叫做 "llamaplot" 而Colin 更喜歡 "nplot" 這個名字。後來他們都同意命名他們的程序為 "newplot",可是很快他們發現有個Pascal 語言寫的程序叫這個名字,而且這個程序偶爾會被提到。最後 Thomas 想出了"gnuplot" 這個雙方都可以接受的名字。
gnuplot 在互聯網上的主頁地址是:http://www.gnuplot.info/ , 源代碼和可執行程序也可以到http://sourceforge.net/projects/gnuplot/上下載。
gnuplot有詳細的使用手冊,如果用戶使用的是GNU/Linux操作系統,可以察看 /usr/share/doc/gnuplot目錄下的gnuplot.html文件。需要PDF版本的使用手冊可以到http://sourceforge.net/projects/gnuplot 下載。本文中所引用范例皆整理自 gnuplot demo。文中的圖例亦引用自子目錄 demo 中的范例。
快速入門
本文全文都以GNU/Linux 下的 gnuplot 4.0版本為例,如果讀者使用的是其他版本的操作系統,個別操作細節請做相應調整。
在命令行模式下輸入 gnuplot,即可看到如下的信息,其中省略號處省略了部分信息:
[plain] view
plaincopy
G N U P L O T
Version 4.0 patchlevel 0
last modified Thu Apr 15 14:44:22 CEST 2004
System: Linux 32 bit
……
Terminal type set to 'x11'
gnuplot>
‘gnuplot>’即是 gnuplot 的命令行提示符,gnuplot 的所有命令都在這個提示符下輸入。
2D 繪圖
請看例 1:
[plain] view
plaincopy
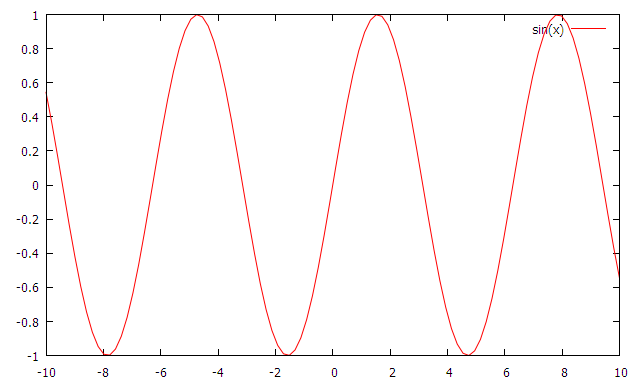
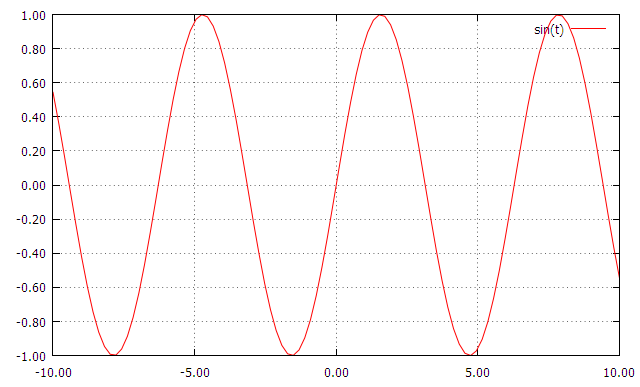
plot sin(x)
產生圖 2結果 ——以曲線繪出三角函數 sin(x)。

圖 1 Plotting sin(x)
假設我們只想看到一個正弦曲線周期。我們通過限制圖的默認 x 范圍來完成此操作。使用表示法 [min:max] 來指定范圍。要僅指定最小值,使用 [min:];要僅指定最大值,使用 [:max]。數學上稱此為所謂的“閉”區間表示法。
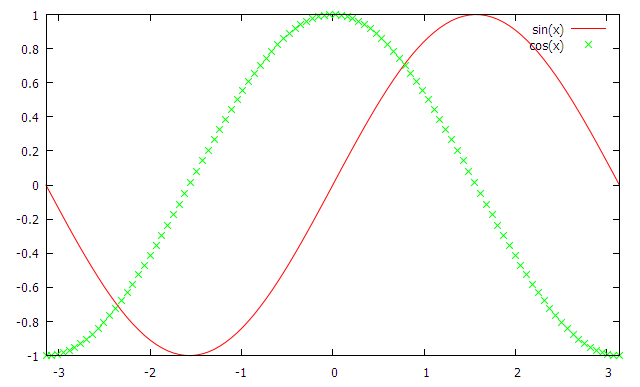
例 2從 -pi 到 +pi 的 sin(x) 和 cos(x)
[plain] view
plaincopy
set xrange [-pi:pi]
replot cos(x) with points pointtype 2
或者:
[plain] view
plaincopy
plot [-pi:pi] sin(x), cos(x) with points pointtype 2
我們剛才使用了 replot 命令,它執行先前的 plot 命令。當您繪制曲線圖且需要不斷對該圖進行修改以添加想要的特征時,此命令會非常有用。另外,replot 使您可以添加更多的圖。嘗試輸入 replot cos(x)。依照語法,該命令等同於 plot sin(x), cos(x)。replot 就是獲取先前的繪圖字符串,添加必要的逗號,然後附加輸入給它的其余部分。
例 5 將數據文件中的數據畫出:
[plain] view
plaincopy
plot sin(x), ‘1.dat’
其中1.dat 為一數據文件,每一行描述一點坐標位置。 內容如下,其中 # 後面的內容為注釋:
[plain] view
plaincopy
# $Id: 1.dat,v 1.1.1.1 1998/04/15 19:16:40 lhecking Exp $
-20.000000 -3.041676
-19.000000 -3.036427
-18.000000 -3.030596
-17.000000 -3.024081
-16.000000 -3.016755
-15.000000 -3.008456
……
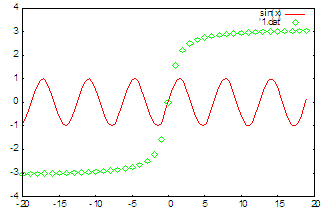
圖 2 Plotting sin(x), data file – 1.dat
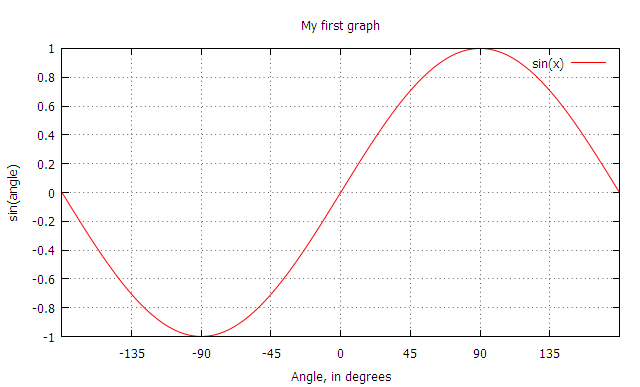
例 6命名圖和坐標軸:
[plain] view
plaincopy
set title 'My first graph'
set xlabel 'Angle, in degrees'
set ylabel 'sin(angle)'
plot sin(x)
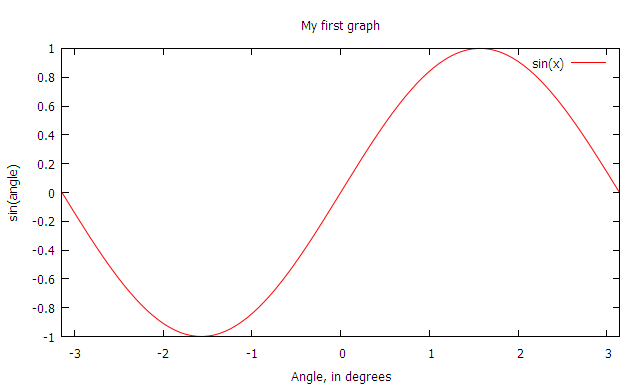
現在,我們注意到 x 軸實際沒有標記為度數,看起來不是很好。要修改此問題,可以通過調整 x 軸上的 tic 標記。
例 7 改變軸上 tic 並設置網格:
[plain] view
plaincopy
set title "My first graph"
set xrange [-pi:pi] # we want only one cycle
set xtics ('0' 0, '90' pi/2, '-90' -pi/2, '45' pi/4,'-45' -pi/4,'135' 3*pi/4,'-135' -3*pi/4)
set grid
set xlabel 'Angle, in degrees'
set ylabel 'sin(angle)'
plot sin(x)
gnuplot 還允許您指定繪圖的樣式,以便獲得進一步的控制。
例 8 多條曲線
[plain] view
plaincopy
plot sin(x) with linespoints pointtype 5, cos(x) w boxes lt 4
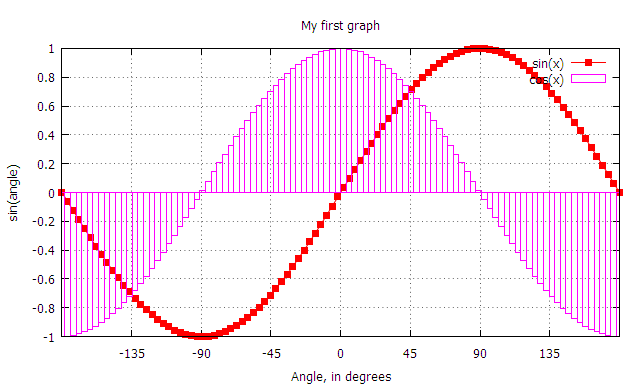
with 子句使您可以詳細而精確地指定線的樣式。在本例中,我們說明兩種有用的樣式。第一種樣式 linespoints 通常在對數據繪圖時非常有用,它在涉及的每個示例或數據點處標記一個點,並使用線性插值法連接連續的點。這裡我們另外指定點類型為 5,它選擇終端允許的第五種點。第二種樣式 boxes 更適合繪制直方圖數據。注意我們如何在 cos(x) 曲線中將 with 縮寫成 w。類似地,lt 是 linetype 的縮寫,是另一個特定於終端的設置,它選擇終端可以繪制的四種線。不必說,您可以使用 pt 代替冗長的 pointtype。如果想在多條線中使用相同的繪圖樣式(在一個 plot 命令中或在多個 plot 命令中),可以使用 set 命令設置繪圖樣式:set style function linespoints。要更改用於繪制與函數相對的數據集合的樣式,使用 set style data linespoints。
當繪制兩條或多條曲線時,我們需要關鍵字或圖例來對它們進行區分。默認情況下,關鍵字在右上角;但是如果它妨礙了圖,可以將關鍵字放到其他位置 。如果願意,甚至可以放到圖外。
例 9 定制圖的關鍵字或圖例
[plain] view
plaincopy
set key top left
set key box
plot [-pi:pi] sin(x) title 'sinusoid' with linespoints pointtype 5, cos(x) t 'cosine' w boxes lt 4
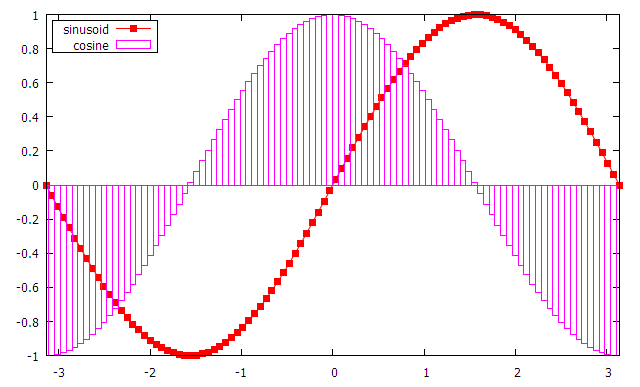
上面,我們在同一圖中繪制了正弦和余弦曲線。gnuplot 使您還可以繪制多個圖,這樣它們可以並排顯示在同一輸出屏幕或文件中。在某些排版系統中,以一個文件的形式包含兩個圖形比分別包含兩個圖形要更容易。
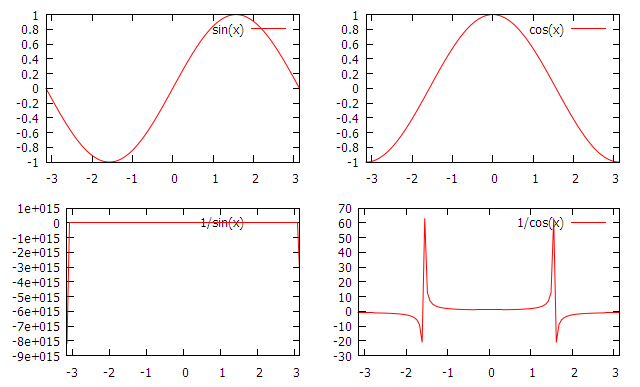
例 10 Multiplot 示例:
[plain] view
plaincopy
set xrange [-pi:pi]
# gnuplot recommends setting the size and origin before going to multiplot mode
# This sets up bounding boxes and may be required on some terminals
set size 1,1
set origin 0,0
# Done interactively, this takes gnuplot into multiplot mode
set multiplot
# plot the first graph so that it takes a quarter of the screen
set size 0.5,0.5
set origin 0,0.5
plot sin(x)
# plot the second graph so that it takes a quarter of the screen
set size 0.5,0.5
set origin 0,0
plot 1/sin(x)
# plot the third graph so that it takes a quarter of the screen
set size 0.5,0.5
set origin 0.5,0.5
plot cos(x)
# plot the fourth graph so that it takes a quarter of the screen
set size 0.5,0.5
set origin 0.5,0
plot 1/cos(x)
# On some terminals, nothing gets plotted until this command is issued
unset multiplot
# remove all customization
reset
3D繪圖
例 11:
[plain] view
plaincopy
splot [-pi:pi] [-pi:pi] sin(x)*cos(y)
產生圖 2結果 --- 以縱橫各 10 條線組成的網格畫出 sin(x)*cos(y) 的圖形。

圖 3 Plotting sin(x)*cos(y)
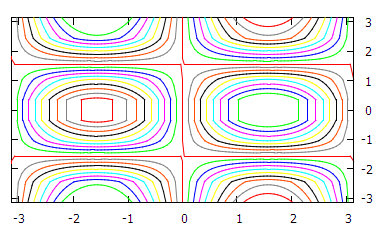
例 12 畫等高線圖:
[plain] view
plaincopy
set dgrid3d 100,100 #設置三維圖表面的網格的數目
set contour #設置畫等高線
set cntrparam levels incremental -0.9,0.1,0.9 #設置等高線的疏密和范圍,數據從 -0.2到0.2中間每隔0.01畫一條線
unset surface # 去掉上面的三維圖形
set view 0,0
unset key
splot [-pi:pi] [-pi:pi] sin(x)*cos(y)
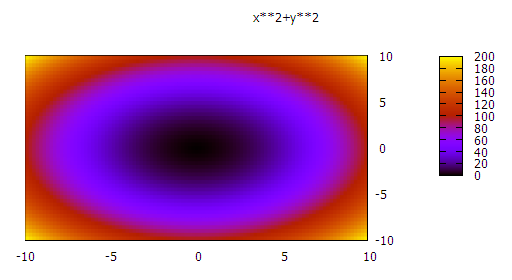
例 13 畫pm3d圖
[plain] view
plaincopy
set pm3d
set isosamples 50,50
splot x**2+y**2
 [plain]
 view
plaincopy
set view 0,0 #設置視角,(0,0)將投影到底面上去
unset ztics #把z軸上的數字給去掉
unset surface
splot x**2+y**2
reset
輸出文件
在啟動時,您可能注意到終端類型設置為 X11。gnuplot采用標准設計,可以在多個終端設備上繪圖。這包括直接打印到多種打印機中,包括 Epson、HP 和 Imagen 打印機。它甚至可以在偽設備中繪圖,如 postscript 和 png。這主要涉及生成輸出文件,而不是可查看文件或打印輸出。這是將您的圖表包含在其他報表中的一種技巧。
例 14 設置輸出和終端類型
[plain] view
plaincopy
set terminal png # gnuplot recommends setting terminal before output
set output ‘output.png’ # The output filename
plot sin(x)
現在,文件 output.png 中有了您剛才繪制的圖。
所有終端在能力上都不相同。其中的一些(如 LaTeX)可能不支持文本的旋轉,所以如果您像我們前面那樣設置 ylabel,在不同的終端中可能顯示不一樣。換句話說,您可以在 LaTeX 的特定終端中使用 LaTex 命令。例如,set ylabel $sin(\\\\theta)$(注意我們使用兩個反斜槓產生一個 LaTex 所需的反斜槓 —— gnuplot 在將雙引號中所括的字符串傳送到終端驅動程序之前,先對其進行反斜槓處理)。現在,您可以使用 \\input{output.tex} 將輸出文件包含在 LaTeX 文件中。要在 PostScript 終端中獲得相同的結果,使用相應的 PostScript 命令:{/Symbol q}。在 enhanced PostScript 和 LaTeX 中,您可以使用表示法 x^{superscript} 和 x_{subscript} 得到上標文字。還要注意縮寫的終端和輸出命令:
例 15 eps 驅動程序的能力
[plain] view
plaincopy
set term post enh # enhanced PostScript, essentially PostScript with bounding boxes
set out 'gplt.eps'
set xlabel '{/Symbol q_1}
set ylabel 'sin^2({/Symbol q_1})'
plot sin(x)**2
其他
順便說一下,我們提供的所有例子都可以在交互模式或批處理模式下運行。要以交互模式運行,在提示符中輸入每個命令。要以批處理模式運行,將命令輸入或添加到文本文件中,然後在 gnuplot提示符中使用 load 'filename' 讀入文件,或者在 shell 提示符下將其作為參數提供給 gnuplot:$ gnuplot filename。使用第二種方法,gnuplot會在執行輸入文件中的所有命令後退出,所以當直接繪圖到文件中時,采用批處理模式執行特別有效。如果在屏幕上繪圖時使用第二種方法,輸出窗口一出現(當 gnuplot退出時)就會消失,所以您需要使用顯式的“pause -1”命令(請參閱 help pause)來保持窗口。
在 X 環境下,gnuplot 如同其他 X client 程序一樣,可接受許多參數。如
[plain] view
plaincopy
gnuplot -font 8x13bold # 設定字形為 8x13bold。
gnuplot -geometry 900x700 # 設定窗口的長為 900 pixel 寬為 700 pixel。
gnuplot -bg black # 設定背景顏色為黑色。
gnuplot 繪制數學函數或數值資料的步驟大體如:
定義常數及函數:定義常數及函數,使程式模組化及易於了解。
設定繪圖環境:gnuplot 繪圖之前已預先設定許多繪圖參數。
繪圖:在定義數學函數或設定繪圖環境之後,接著就是繪出數學函數或數值資料的圖形。gnuplot 提供操作方便的繪圖指令——plot (2D) 或 splot (3D)。
產生輸出結果:在終端上繪出結果後,可經由一些步驟而產生不同輸出裝置所需的輸出。
依照上述過程,可快速地畫出圖形。剩下的步驟就是細心的調整繪圖環境參數或修改函數方程式、常數等,即可得到滿意的結果。
常量、操作符和函數
數字
gnuplot 表示數字可分成整數、實數及復數三類:
整數:gnuplot 與 C 語言相同,采用 4 byte 儲存整數。故能表示 -2147483647 至 +2147483647 之間的整數。
實數:能表示約 6 或 7 位的有效位數,指數部份為不大於 308 的數字。
復數:以 {<real>,<imag>} 表示復數。其中<real>為復數的實數部分,<imag>為虛數部分,此兩部分均以實數型態表示。 如 3 + 2i 即以 {3,2} 表示。
gnuplot 儲存數字的原則為,若能以整數方式儲存則以整數儲存數字,不然以實數方式儲存,其次以復數方式儲存。例如在 gnuplot 執行
[plain] view
plaincopy
print 1/3*3
print 1./3*3
分別得到 0 和 1.0 的結果。這是因前者使用整數計算,而後者采用實數計算的結果。執行
[plain] view
plaincopy
print 1234.567
print 12345 + 0.56789
print 1.23e300 * 2e6
print 1.23e300 * 2e8
分別得到 1234.57、12345.6、2.46e+304 和 undefined value 的結果。這些例子是受到實數的有效位數和所能表現最大數字的限制。這是我們要注意的。
操作符
gnuplot 的操作符與 C 語言基本相同。 所有的操作均可做用在整數、實數或復數上。
表格 1 Unary Operators
Symbol
Example
Explanation
-
-a
unary minus
~
~a
one's complement
!
!a
logical negation
!
a!
factorial
表格 2 Binary Operators
Symbol
Example
Explanation
**
a**b
exponentiation
*
a*b
multiplication
/
a/b
division
%
a%b
modulo
+
a+b
addition
-
a-b
subtraction
==
a==b
equality
!=
a!=b
inequality
&
a&b
bitwise AND
^
a^b
bitwise exclusive OR
|
a|b
bitwise inclusive OR
&&
a&&b
logical AND
||
a||b
logical OR
?:
a?b:c
ternary operation
函數
在 gnuplot 中函數的參數可以是整數,實數或是復數。表格 3是 gnuplot 所提供的函數。
表格 3 gnuplot functions
Function
Auguments
Returns
abs(x)
any
absolute value of x, |x|; same type
abs(x)
complex
length of x, sqrt( real(x)^2 + imag(x)^2 )
acos(x)
any
1/cos(x) (inverse cosine) in radians
Acosh(x)
any
cosh−1 x (inverse hyperbolic cosine) in radians
arg(x)
complex
the phase of x in radians
asin(x)
any
1/sin(x) (inverse sin) in radians
asinh(x)
any
sinh−1 x (inverse hyperbolic sin) in radians
atan(x)
any
1/tan(x) (inverse tangent) in radians
atan2(y,x)
int or real
tan−1(y/x) (inverse tangent)
atanh(x)
any
tanh−1 x (inverse hyperbolic tangent) in radians
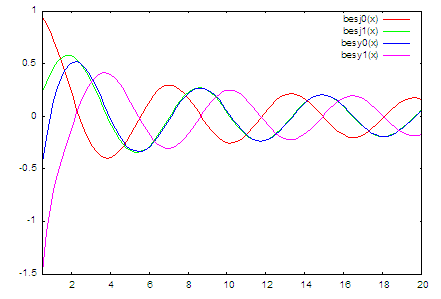
besj0(x)
int or real
J0 Bessel function of x
besj1(x)
int or real
J1 Bessel function of x
besy0(x)
int or real
Y0 Bessel function of x
besy1(x)
int or real
Y1 Bessel function of x
ceil(x)
any
smallest integer not less than x (real part)
cos(x)
radians
cos x, cosine of x
cosh(x)
radians
cosh x, hyperbolic cosine of x
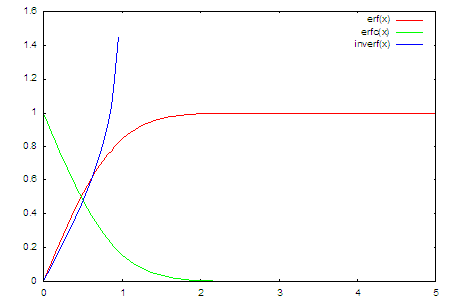
erf(x)
any
Erf(real(x)), error function of real(x)
erfc(x)
any
Erfc(real(x)), 1.0 - error function of real(x)
exp(x)
any
exponential function of x
floor(x)
any
largest integer not greater than x (real part)
gamma(x)
any
Gamma(real(x)), gamma function of real(x)
ibeta(p,q,x)
any
Ibeta(real(p,q,x)), ibeta function of real(p,q,x)
inverf(x)
any
inverse error function of real(x)
igamma(a,x)
any
Igamma(real(a,x)), igamma function of real(a,x)
imag(x)
complex
imaginary part of x as a real number
invnorm(x)
any
inverse normal distribution function of real(x)
int(x)
real
integer part of x, truncated toward zero
lambertw(x)
real
Lambert W function
lgamma(x)
any
Lgamma(real(x)), lgamma function of real(x)
log(x)
any
ln(x), natural logarithm (base e) of x
log10(x)
any
log(x), logarithm (base 10) of x
norm(x)
any
normal distribution (Gaussian) function of real(x)
rand(x)
any
normal distribution (Gaussian) function of real(x)
real(x)
any
Rand(real(x)), pseudo random number generator
sgn(x)
any
real part of x
sin(x)
any
1 if x>0, -1 if x<0, 0 if x=0. imag(x) ignored
sinh(x)
radians
sin(x), sine of x
sqrt(x)
radians
sinh(x), hyperbolic sine x
tan(x)
any
sqrt(x), square root of x
tanh(x)
complex
tan(x), tangent of x
column(x)
int
column x during datafile manipulation.
defined(X)
variable name
returns 1 if a variable X is defined, 0 otherwise.
tm hour(x)
int
the hour
tm mday(x)
int
the day of the month
tm min(x)
int
the minute
tm mon(x)
int
the month
tm sec(x)
int
the second
tm wday(x)
int
the day of the week
tm yday(x)
int
the day of the year
tm year(x)
int
the year
valid(x)
int
test validity of column(x) during datafile manip.
下面舉一些例子:
[plain] view
plaincopy
plot [0.5:20] besj0(x), besj1(x), besy0(x), besy1(x)
plot [0:5] erf(x), erfc(x), inverf(x)
用戶自定義函數和常量
在 gnuplot 中,用戶可自定函數。函數可有 1 至 5 個自變量。 其定義函數的語法如下:
[plain] view
plaincopy
<function-name> ( <dummy1> {,<dummy2> {, ...}}) = <expression>
而用戶定義常數的語法如下:
[plain] view
plaincopy
<variable-name> = <constant-expression>
下面舉一些例子:
[plain] view
plaincopy
# 常數 w 為 2。
w = 2
# 常數 q 為小於但最接近 tan(pi/2 - 0.1) 的整數。
q = floor(tan(pi/2 - 0.1))
# 函數 f(x) 為 sin(w*x),其中 w 為常數。
f(x) = sin(w*x)
# 函數 sinc(x) 為 sin(pi*x)/(pi*x)。
sinc(x) = sin(pi*x)/(pi*x)
# 函數 delta(t) 為脈沖函數。
delta(t) = (t == 0)
# 函數 ramp(t) 當其小於零為零,當其大於零為斜率等於 1 的直線。
ramp(t) = (t > 0) ? t : 0
# 函數 min(a,b) 取兩者中較小的數。
min(a,b) = (a < b) ? a : b
comb(n,k) = n!/(k!*(n-k)!)
len3d(x,y,z) = sqrt(x*x+y*y+z*z)
plot f(x) = sin(x*a), a = 0.2, f(x), a = 0.4, f(x)

gnuplot 已定義的常數僅有 pi (pi = 3.14159)。
繪圖環境參數
如第二章所述,只要鍵入 plot sin(x), '1.dat' 即可得到圖1 的結果。gnuplot 自動調整 X 軸、 Y 軸的顯示范圍,使圖形顯示在適當的位置並選擇不同的顏色、圖形,用以區別不同的函數或數據,也就是 gnuplot 自動調整其所需的繪圖環境。若我們需要一些特別的繪圖參數,如在 3D 中加入等高線、設定消去隱藏線、改變 X 軸、Y 軸的座標點名稱等,可由改變繪圖環境參數而改變之。 本章說明這些繪圖參數設定的方法與功能。
Axis
繪圖參數在設定坐標軸方面的參數可分為變量名稱、數字格式、網格、顯示范圍、坐標軸顯示方式與顯示與否等六方面的設定:
變量名稱設定
一般以 x 為橫軸上的變量。可用 dummy 設定為其它的名稱, 所繪函數的變量名稱亦隨之改變。如 set dummy t 將自變量改為 t,圖8、圖17、圖20 均改變自變量名稱。
數字格式設定
設定數字的顯示方式與格式。由 format 此項參數設定顯示格式,其語法為 :
[plain] view
plaincopy
set format {<axes>} {"<format-string>"}
show format # 顯示各軸數字顯示的型式
其中 axis 為 x、y、z、xy 或預設為xy。format-string 為描述數字格式的字符串,可接受如 C 語言中 printf 對數字的 f、e、g 三種格式化描述,亦可加入文字 (必須少於100 字)。以下舉一些例子:
[plain] view
plaincopy
set format xy "%.2e"
set format x "%3.0f cm"
顯示方式由 tics、xtics等設定。
xtics 是對 X 坐標軸上的格點做設定。如起始點、結束點、間隔或在軸上特定點放特定的名稱。其語法為:
[plain] view
plaincopy
set xtics { {<start>, <incr>{, <end>}} |
{({"<label>"} <pos> {, {"<label>"} <pos>}...)} }
set noxtics # 不標示任何 X 軸上的標點。
show xtics # 顯示 X 軸標點的狀況。
下面是三個改變格點的例子。
[html] view
plaincopy
# 每隔 2 格一個標點
set xtics -10,2,10
plot sin(x)
 [plain]
 view
plaincopy
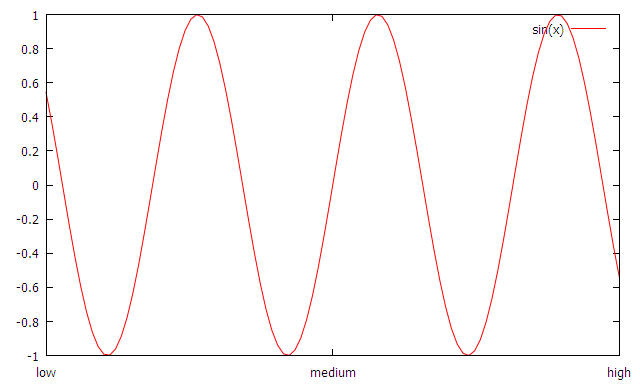
# 以文字作為標點
set xtics ("low" -10, "medium" 0, "high" 10)
plot sin(x)
 [plain]
 view
plaincopy
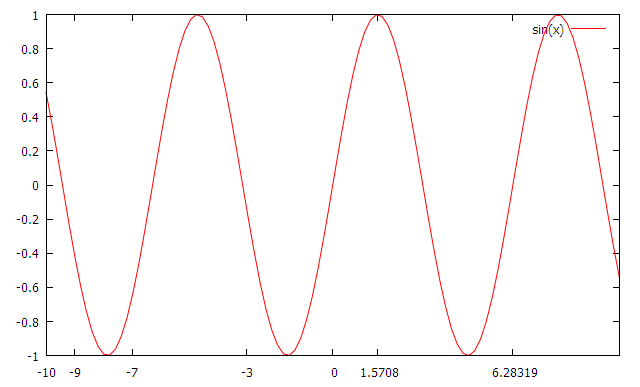
# 在特定位置放上標點
set xtics (-10,-9,-7,-3,0,pi/2,2*pi)
plot sin(x)
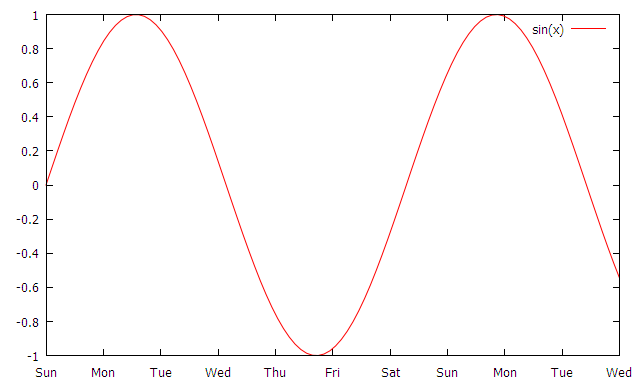
xdtics 將 X 座標軸上標點名稱依 0,1,…改為 Sun,Mon,… Sat 等。 大於 7 的數目除以7 取其馀數。
[plain] view
plaincopy
# 將標點名稱改為 Sun, Mon, ... Sat 等
set xdtics
plot [0 : 10] sin(x)
ytics, ymtics, ydtics, ztics, zmtics, zdtics 與 xtics, xmtics, xdtics 相似,不同點是作用在不同的軸上。
ticslevel 是在畫 3D 圖形時,調整 Z 軸的相對高度。語法為:
[plain] view
plaincopy
set ticslevel {<level>}
show tics
網格設定
在 XY 座標平面上依刻度畫上方格子。
[plain] view
plaincopy
# 設定變數為 t
set dummy t
# 設定 X 軸 Y 軸標點的格式
set format xy "%3.2f"
# 產生網格
set grid
plot sin(t)
座標顯示方式
分為線性與對數兩種。一般為前者,若要改為對數方式,其語法為:
[plain] view
plaincopy
set logscale <axes> <base>
set nologscale <axes>
show logscale
其中 axes 為 X 軸、Y 軸、Z 軸的任意組合。base 預設為 10。
顯示范圍設定
改變各軸的顯示范圍。autoscale 參數設定後 gnuplot 自動調整顯示范圍。其余的如 rrange, trange, xrange, yrange, zrange 則是由使用者設定該軸的范圍,以 xrange 為例,其語法為:
[plain] view
plaincopy
set xrange [{<xmin> : <xmax>}]
其中參數 <xmin> 與 <xmax> 代表 X 軸的起點與終點, 可以是數字或數學式子。如圖7 中 set [0:10] sin(x) 設定 X 軸顯示范圍為 0 與 10 之間。此時可用
[plain] view
plaincopy
set xrange [0:10]
plot sin(x)
使用 autoscale 參數調整顯示范圍,其語法為:
[plain] view
plaincopy
set autoscale <axes>
set noautoscal <axes>
show autoscale
其中 <axes> 為 gnuplot 欲調整的軸,可以是 x, y, z 或 xy,預設為所有的軸。
座標軸顯示與否設定
設定是否要畫出座標軸,以 X 軸為例:
[plain] view
plaincopy
set xzeroaxis # 設定顯示 X 座標軸
set noxzeroaxis # 設定不顯示 X 座標軸
show xzeroaxis # 檢查 X 座標軸顯示與否
Label
gnuplot 除了繪出圖形外,尚可加入注解做為輔助說明。這注解包括文字與線條兩方面,其提供的設定有:
功能
繪圖參數名稱
線條
arrow
文字注解
key, label, time, title, xlabel, ylabel, zlabel
線條
在圖上畫一線段可以選擇有無箭頭。其語法為:
[plain] view
plaincopy
set arrow {<tag>} {from <sx>,<sy>{,<sz>}}
{to <ex>,<ey>{,<ez>}} {{no}head}
unset arrow {<tag>} # 刪除一線條
show arrow # 顯示線條使用情況
其中參數 <tag> 是給該條線條一個整數名稱,若不設定則為最小可用整數。此線條由坐標 (sx, sy, sz) 到 (ex, ey, ez) (在 2D 中為 (sx, sy)到(ex, ey))。參數 nohead 為畫沒有箭頭的線段,參數 head 或沒有 nohead 為畫有箭頭的線段。圖24 中使用沒有箭頭的線段作為輔助說明。以下為一些例子:
[plain] view
plaincopy
# 畫一帶有箭頭的線條由原點到 (1,2)。
set arrow to 1,2
# 畫一名為 3 的帶箭頭線條 由 (-10,4,2) 到 (-5,5,3)。
set arrow 3 from -10,4,2 to -5,5,3
# 改變名為 3 的線條起始點至 (1,1,1)。
set arrow 3 from 1,1,1
# 刪除名為 2 的線條。
unset arrow 2
# 刪除所有線條。
unset arrow
# 顯示線條的使用情形。
show arrow
文字注解
分為設定標題 (title),標示 (label) 與時間 (time) 三部份。標題設定為在圖的正上方加上說明本圖的文字。其語法為:
[plain] view
plaincopy
set title {"<title-text>"} {<xoff>}{,<yoff>}
show title
設定參數 <xoff> 或 <yoff> 為微調標頭放置的位址。 xlabel, ylabel, zlabel 的語法與 title 相同,其各自描述一坐標軸。
標示 (label) 為在圖上任一位置加上文字說明,一般與線條一並使用。其語法為:
[plain] view
plaincopy
set label {<tag>} {"<label_text>"}
{at <x>,<y>{,<z>}}{<justification>}
unset label {<tag>} # 刪除一標示
show label # 顯示標示使用情況
其中參數 <tag> 與 "線條" (arrow) 中 <tag> 意義相同,用以區別不同的 label。參數 <justification> 是調整文字放置的位置,可以是 left,right 或 center。舉一些例子:
[plain] view
plaincopy
# 將 y=x 放在座標 (1,2) 之處。
set label "y=x" at 1,2
# 將 y=x^2 放在座標 (2,3,4) 之處,並命名為 3。
set label 3 "y=x^2" at 2,3,4 right
# 將名為 3 的標示居中放置。
set label 3 center
# 刪除名為 2 的標示。
set nolabel 2
# 刪除所有標示。
set nolabel
# 顯示標示使用情形。
show label
一般繪一圖形後,gnuplot 將函數名稱或圖形名稱置於右上角。 key 參數設定可改變名稱放置位置。其語法為:
[plain] view
plaincopy
set key
set key <x>,<y>{,<z>}
unset key
show key
其中參數 <x>, <y>, <z> 設定名稱放置位置 。unset key 為不顯示名稱,若使用 set key 則再度顯示名稱。若使用 set key 0.2, 0.5 則顯示函數名稱於坐標 (0.2, 0.5) 之處。
[plain] view
plaincopy
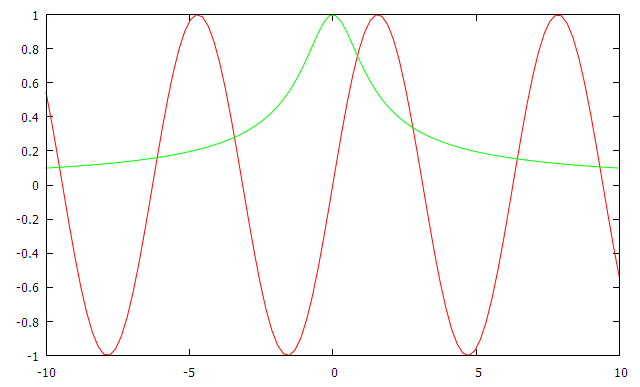
unset key
plot sin(x), cos(atan(x))
 [plain]
 view
plaincopy
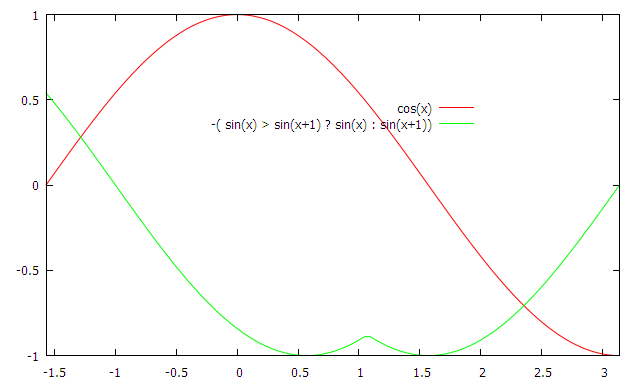
<p>set key at 2, 0.5
plot [-pi/2:pi] cos(x), -( sin(x) > sin(x+1) ? sin(x) : sin(x+1))</p>
時間參數設定是將圖產生的時間標在圖上。其語法為
[plain] view
plaincopy
set time {<xoff>}{,<yoff>}
unset time
show time
設定參數 <xoff> 或 <yoff> 為微調時間放置的位址,正數表示向上或向右,負數為反方向,以字的長寬作為單位。
[plain] view
plaincopy
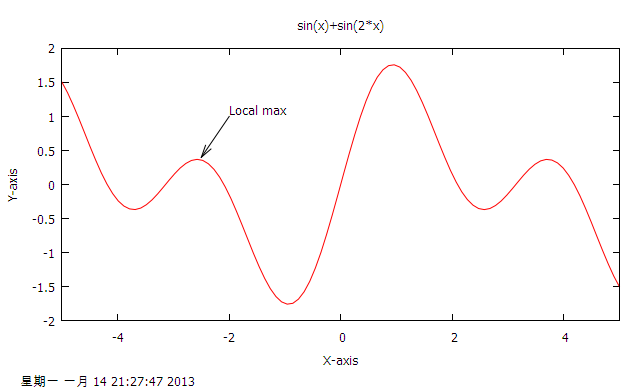
set title "sin(x)+sin(2*x)"
set xlabel "X-axis"
set ylabel "Y-axis"
set arrow from -2,1 to -2.5,0.4
set label "Local max" at -2,1.1
unset key
set time
plot [-5:5] sin(x)+sin(2*x)