Valgrind是一套Linux下,開放源代碼(GPL V2)的仿真調試工具的集合。Valgrind由內核(core)以及基於內核的其他調試工具組成。內核類似於一個框架(framework),它模擬了一個CPU環境,並提供服務給其他工具;而其他工具則類似於插件 (plug-in),利用內核提供的服務完成各種特定的內存調試任務。Valgrind的體系結構如下圖所示:
圖1
Valgrind的最新版是3.11.0,它一般包含下列工具:
1.Memcheck
最常用的工具,用來檢測程序中出現的內存問題,所有對內存的讀寫都會被檢測到,一切對malloc()/free()/new/delete的調用都會被捕獲。所以,它能檢測以下問題:
對未初始化內存的使用;
讀/寫釋放後的內存塊;
讀/寫超出malloc分配的內存塊;
讀/寫不適當的棧中內存塊;
內存洩漏,指向一塊內存的指針永遠丟失;
不正確的malloc/free或new/delete匹配;
memcpy()相關函數中的dst和src指針重疊。
2.Callgrind
和gprof類似的分析工具,但它對程序的運行觀察更是入微,能給我們提供更多的信息。和gprof不同,它不需要在編譯源代碼時附加特殊選項,但加上調試選項是推薦的。Callgrind收集程序運行時的一些數據,建立函數調用關系圖,還可以有選擇地進行cache模擬。在運行結束時,它會把分析數據寫入一個文件。callgrind_annotate可以把這個文件的內容轉化成可讀的形式。
3.Cachegrind
Cache分析器,它模擬CPU中的一級緩存I1,Dl和二級緩存,能夠精確地指出程序中cache的丟失和命中。如果需要,它還能夠為我們提供cache丟失次數,內存引用次數,以及每行代碼,每個函數,每個模塊,整個程序產生的指令數。這對優化程序有很大的幫助。
4.Helgrind
它主要用來檢查多線程程序中出現的競爭問題。Helgrind尋找內存中被多個線程訪問,而又沒有一貫加鎖的區域,這些區域往往是線程之間失去同步的地方,而且會導致難以發掘的錯誤。Helgrind實現了名為“Eraser”的競爭檢測算法,並做了進一步改進,減少了報告錯誤的次數。不過,Helgrind仍然處於實驗階段。
5.Massif
堆棧分析器,它能測量程序在堆棧中使用了多少內存,告訴我們堆塊,堆管理塊和棧的大小。Massif能幫助我們減少內存的使用,在帶有虛擬內存的現代系統中,它還能夠加速我們程序的運行,減少程序停留在交換區中的幾率。
此外,lackey和nulgrind也會提供。Lackey是小型工具,很少用到;Nulgrind只是為開發者展示如何創建一個工具。
1.3 原理
Memcheck 能夠檢測出內存問題,關鍵在於其建立了兩個全局表。Valid-Value 表
對於進程的整個地址空間中的每一個字節(byte),都有與之對應的 8 個 bits;對於CPU的每個寄存器,也有一個與之對應的bit向量。這些bits負責記錄該字節或者寄存器值是否具有有效的、已初始化的值。
Valid-Address 表
對於進程整個地址空間中的每一個字節(byte),還有與之對應的1個bit,負責記錄該地址是否能夠被讀寫。
檢測原理:
當要讀寫內存中某個字節時,首先檢查這個字節對應的 A bit。如果該A bit顯示該位置是無效位置,memcheck則報告讀寫錯誤。
內核(core)類似於一個虛擬的 CPU 環境,這樣當內存中的某個字節被加載到真實的 CPU 中時,該字節對應的 V bit 也被加載到虛擬的 CPU 環境中。一旦寄存器中的值,被用來產生內存地址,或者該值能夠影響程序輸出,則 memcheck 會檢查對應的V bits,如果該值尚未初始化,則會報告使用未初始化內存錯誤。
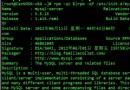
從官網http://www.valgrind.org下載最新版本(當前3.11)
#tar xvf valgrind-3.11.1.tar.bz2
#cd valgrind-3.11.1
#./configure --prefix=/usr/local/valgrind--指定安裝目錄
#make
#make install
用法:valgrind[options] prog-and-args [options]: 常用選項,適用於所有Valgrind工具
LOG信息輸出:
適用於Memcheck工具的相關選項:
下面通過介紹幾個范例來說明如何使用Memcheck (其他工具暫不涉及,感興趣可以交流),示例僅供參考,更多用途可在實際應用中不斷探索。
#include<stdlib.h>
void k(void)
{
int *x = malloc(8 * sizeof(int));
x[9] = 0; //數組下標越界
} //內存未釋放
int main(void)
{
k();
return 0;
}
1)編譯程序test.c
gcc -Wall test.c -g -o test#Wall提示所有告警,-g gdb,-o輸出
2)使用Valgrind檢查程序BUG
valgrind --tool=memcheck --leak-check=full ./test
#--leak-check=full 所有洩露檢查
3) 運行結果如下:
==2989== Memcheck, a memory error detector
==2989== Copyright (C) 2002-2012, and GNU GPL'd, by Julian Seward
et al.
==2989== Using Valgrind-3.8.1 and LibVEX; rerun with -h for
copyright info
==2989== Command: ./test
==2989==
==2989== Invalid write of size 4
==2989== at 0x4004E2: k (test.c:5)
==2989== by 0x4004F2: main (test.c:10)
==2989== Address 0x4c27064 is 4 bytes after a block of size 32 alloc'd
==2989== at 0x4A06A2E: malloc (vg_replace_malloc.c:270)
==2989== by 0x4004D5: k (test.c:4)
==2989== by 0x4004F2: main (test.c:10)
==2989==
==2989==
==2989== HEAP SUMMARY:
==2989== in use at exit: 32 bytes in 1 blocks
==2989== total heap usage: 1 allocs, 0 frees, 32 bytes allocated
==2989==
==2989== 32 bytes in 1 blocks are definitely lost in loss record 1
of 1
==2989== at 0x4A06A2E: malloc (vg_replace_malloc.c:270)
==2989== by 0x4004D5: k (test.c:4)
==2989== by 0x4004F2: main (test.c:10)
==2989==
==2989== LEAK SUMMARY:
==2989== definitely lost: 32 bytes in 1 blocks
==2989== indirectly lost: 0 bytes in 0 blocks
==2989== possibly lost: 0 bytes in 0 blocks
==2989== still reachable: 0 bytes in 0 blocks
==2989==suppressed: 0 bytes in 0 blocks
==2989==
==2989== For counts of detected and suppressed errors, rerun with: -v
==2989== ERROR SUMMARY: 2 errors from 2 contexts
(suppressed: 6 from 6)
#include <stdio.h>
#include <stdlib.h>
int main(void)
{
char *p = malloc(1); //分配
*p = 'a';
char c = *p;
printf("\n [%c]\n",c);
free(p); //釋放
c = *p; //取值
return 0;
}
1)編譯程序t2.c
gcc -Wall t2.c -g -o t2
2)使用Valgrind檢查程序BUG
valgrind --tool=memcheck --leak-check=full ./t2
3) 運行結果如下:
==3058== Memcheck, a memory error detector
==3058== Copyright (C) 2002-2012, and GNU GPL'd, by Julian
Seward et al.
==3058== Using Valgrind-3.8.1 and LibVEX; rerun with -h
for copyright info
==3058== Command: ./t2
==3058==
[a]
==3058== Invalid read of size 1
==3058== at 0x4005A3: main (t2.c:14)
==3058== Address 0x4c27040 is 0 bytes inside a block of size
1 free'd
==3058== at 0x4A06430: free (vg_replace_malloc.c:446)
==3058== by 0x40059E: main (t2.c:13)
==3058==
==3058==
==3058== HEAP SUMMARY:
==3058== in use at exit: 0 bytes in 0 blocks
==3058== total heap usage: 1 allocs, 1 frees, 1 bytes allocated
==3058==
==3058== All heap blocks were freed -- no leaks are possible
==3058==
==3058== For counts of detected and suppressed errors, rerun with:
-v
==3058== ERROR SUMMARY: 1 errors from 1 contexts
(suppressed: 6 from 6)
從上輸出內容可以看到,Valgrind檢測到無效的讀取操作然後輸出“Invalid read of size 1”。
#include <stdio.h>
#include <stdlib.h>
int main(void)
{
char *p = malloc(1); //分配1字節
*p = 'a';
char c = *(p+1); //地址加1
printf("\n [%c]\n",c);
free(p);
return 0;
}
1)編譯程序t3.c
gcc -Wall t3.c -g -o t3
2)使用Valgrind檢查程序BUG
valgrind --tool=memcheck --leak-check=full ./t3
3) 運行結果如下:
==3128== Memcheck, a memory error detector
==3128== Copyright (C) 2002-2012, and GNU GPL'd, by Julian Seward et al.
==3128== Using Valgrind-3.8.1 and LibVEX; rerun with -h for copyright info
==3128== Command: ./t3
==3128==
==3128== Invalid read of size 1 #無效讀取
==3128==at 0x400579: main (t3.c:9)
==3128==Address 0x4c27041 is 0 bytes after a block of size 1 alloc'd
==3128==at 0x4A06A2E: malloc (vg_replace_malloc.c:270)
==3128==by 0x400565: main (t3.c:6)
==3128==
[]
==3128==
==3128== HEAP SUMMARY:
==3128==in use at exit: 0 bytes in 0 blocks
==3128==total heap usage: 1 allocs, 1 frees, 1 bytes allocated
==3128==
==3128== All heap blocks were freed -- no leaks are possible
==3128==
==3128== For counts of detected and suppressed errors, rerun with: -v
==3128== ERROR SUMMARY: 1 errors from 1 contexts
(suppressed: 6 from 6)
#include <stdio.h>
#include <stdlib.h>
int main(void)
{
int *p = malloc(1);
*p = 'x';
char c = *p;
printf("%c\n",c); //申請後未釋放
return 0;
}
1)編譯程序t4.c
gcc -Wall t4.c -g -o t4
2)使用Valgrind檢查程序BUG
valgrind --tool=memcheck --leak-check=full ./t4
3) 運行結果如下:
==3221== Memcheck, a memory error detector
==3221== Copyright (C) 2002-2012, and GNU GPL'd, by Julian Seward et al.
==3221== Using Valgrind-3.8.1 and LibVEX; rerun with -h for copyright info
==3221== Command: ./t4
==3221==
==3221== Invalid write of size 4
==3221==at 0x40051E: main (t4.c:7)
==3221==Address 0x4c27040 is 0 bytes inside a block of size 1 alloc'd
==3221==at 0x4A06A2E: malloc (vg_replace_malloc.c:270)
==3221==by 0x400515: main (t4.c:6)
==3221==
==3221== Invalid read of size 4
==3221==at 0x400528: main (t4.c:8)
==3221==Address 0x4c27040 is 0 bytes inside a block of size 1 alloc'd
==3221==at 0x4A06A2E: malloc (vg_replace_malloc.c:270)
==3221==by 0x400515: main (t4.c:6)
==3221==
x
==3221==
==3221== HEAP SUMMARY:
==3221==in use at exit: 1 bytes in 1 blocks
==3221==total heap usage: 1 allocs, 0 frees, 1 bytes allocated
==3221==
==3221== 1 bytes in 1 blocks are definitely lost in loss record 1 of 1
==3221==at 0x4A06A2E: malloc (vg_replace_malloc.c:270)
==3221==by 0x400515: main (t4.c:6)
==3221==
==3221== LEAK SUMMARY:
==3221==definitely lost: 1 bytes in 1 blocks
==3221==indirectly lost: 0 bytes in 0 blocks
==3221== possibly lost: 0 bytes in 0 blocks
==3221==still reachable: 0 bytes in 0 blocks
==3221== suppressed: 0 bytes in 0 blocks
==3221==
==3221== For counts of detected and suppressed errors, rerun with: -v
==3221== ERROR SUMMARY: 3 errors from 3 contexts
(suppressed: 6 from 6)
從檢查結果看,可以發現內存洩露。
#include <stdio.h>
#include <stdlib.h>
int main(void)
{
char *p;
p=(char *)malloc(100);
if(p)
printf("Memory Allocated at: %s/n",p);
else
printf("Not Enough Memory!/n");
free(p); //重復釋放
free(p);
free(p);
return 0;
}
1)編譯程序t5.c
gcc -Wall t5.c -g -o t5
2)使用Valgrind檢查程序BUG
valgrind --tool=memcheck --leak-check=full ./t5
3) 運行結果如下:
==3294== Memcheck, a memory error detector
==3294== Copyright (C) 2002-2012, and GNU GPL'd, by Julian Seward
et al.
==3294== Using Valgrind-3.8.1 and LibVEX; rerun with -h for
copyright info
==3294== Command: ./t5
==3294==
==3294== Conditional jump or move depends on uninitialised value(s)
==3294== at 0x3CD4C47E2C: vfprintf (in /lib64/libc-2.12.so)
==3294== by 0x3CD4C4F189: printf (in /lib64/libc-2.12.so)
==3294== by 0x400589: main (t5.c:9)
==3294==
==3294== Invalid free() / delete / delete[] / realloc()
==3294== at 0x4A06430: free (vg_replace_malloc.c:446)
==3294== by 0x4005B5: main (t5.c:13)
==3294== Address 0x4c27040 is 0 bytes inside a block of size
100 free'd
==3294== at 0x4A06430: free (vg_replace_malloc.c:446)
==3294== by 0x4005A9: main (t5.c:12)
==3294==
==3294== Invalid free() / delete / delete[] / realloc()
==3294== at 0x4A06430: free (vg_replace_malloc.c:446)
==3294== by 0x4005C1: main (t5.c:14)
==3294== Address 0x4c27040 is 0 bytes inside a block of size
100 free'd
==3294== at 0x4A06430: free (vg_replace_malloc.c:446)
==3294== by 0x4005A9: main (t5.c:12)
==3294==
Memory Allocated at: /n==3294==
==3294== HEAP SUMMARY:
==3294== in use at exit: 0 bytes in 0 blocks
==3294== total heap usage: 1 allocs, 3 frees, 100 bytes allocated
從上面的輸出可以看到(標注), 該功能檢測到我們對同一個指針調用了3次釋放內存操作。
常見的內存分配方式分三種:靜態存儲,棧上分配,堆上分配。全局變量屬於靜態存儲,它們是在編譯時就被分配了存儲空間,函數內的局部變量屬於棧上分配,而最靈活的內存使用方式當屬堆上分配,也叫做內存動態分配了。常用的內存動態分配函數包括:malloc, alloc, realloc, new等,動態釋放函數包括free, delete。
一旦成功申請了動態內存,我們就需要自己對其進行內存管理,而這又是最容易犯錯誤的。下面的一段程序,就包括了內存動態管理中常見的錯誤。
#include <stdio.h>
#include <stdlib.h>
int main(int argc,char *argv[])
{
int i;
char* p = (char*)malloc(10);
char* pt=p;
for(i = 0;i < 10;i++)
{
p[i] = 'z';
}
free(p);
pt[1] = 'x';
free(pt);
return 0;
}
1)編譯程序t6.c
gcc -Wall t6.c -g -o t6
2)使用Valgrind檢查程序BUG
valgrind --tool=memcheck --leak-check=full ./t6
3) 運行結果如下:
==3380== Memcheck, a memory error detector
==3380== Copyright (C) 2002-2012, and GNU GPL'd, by Julian Seward et al.
==3380== Using Valgrind-3.8.1 and LibVEX; rerun with -h for copyright info
==3380== Command: ./t6
==3380==
==3380== Invalid write of size 1
==3380==at 0x40055C: main (t6.c:14)
==3380==Address 0x4c27041 is 1 bytes inside a block of size 10 free'd
==3380==at 0x4A06430: free (vg_replace_malloc.c:446)
==3380==by 0x400553: main (t6.c:13)
==3380==
==3380== Invalid free() / delete / delete[] / realloc()
==3380==at 0x4A06430: free (vg_replace_malloc.c:446)
==3380==by 0x40056A: main (t6.c:15)
==3380==Address 0x4c27040 is 0 bytes inside a block of size 10 free'd
==3380==at 0x4A06430: free (vg_replace_malloc.c:446)
==3380==by 0x400553: main (t6.c:13)
==3380==
==3380==
==3380== HEAP SUMMARY:
==3380==in use at exit: 0 bytes in 0 blocks
==3380==total heap usage: 1 allocs, 2 frees, 10 bytes allocated
申請內存在使用完成後就要釋放。如果沒有釋放,或少釋放了就是內存洩露;多釋放也會產生問題。上述程序中,指針p和pt指向的是同一塊內存,卻被先後釋放兩次。系統會在堆上維護一個動態內存鏈表,如果被釋放,就意味著該塊內存可以繼續被分配給其他部分,如果內存被釋放後再訪問,就可能覆蓋其他部分的信息,這是一種嚴重的錯誤,上述程序第14行中就在釋放後仍然寫這塊內存。
輸出結果顯示,第13行分配和釋放函數不一致;第14行發生非法寫操作,也就是往釋放後的內存地址寫值;第15行釋放內存函數無效。
Valgrind *不是* 洩漏檢查工具 http://www.linuxidc.com/Linux/2014-12/110481.htm
Linux下Valgrind的使用概述 http://www.linuxidc.com/Linux/2012-08/67990.htm
Linux下利用Valgrind工具進行內存洩露檢測和性能分析 http://www.linuxidc.com/Linux/2012-06/63754.htm
Ubuntu 內存洩漏檢測工具Valgrind的安裝 http://www.linuxidc.com/Linux/2011-12/49988.htm
Valgrind--Linux下的內存調試和代碼解剖工具 http://www.linuxidc.com/Linux/2011-06/36907.htm
應用 Valgrind 發現 Linux 程序的內存問題[圖文] http://www.linuxidc.com/Linux/2008-11/17502.htm